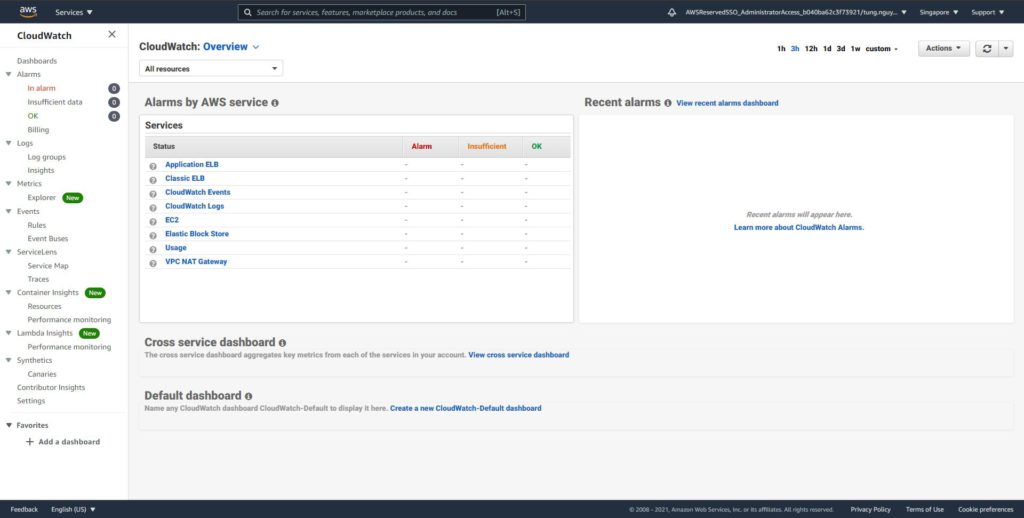
Amazon CloudWatch is a product that provides services to ingest, store, and manage metrics.
There are sub-products that we discover elsewhere in the series such as CloudWatch Logs and CloudWatch Events.
It also provides CloudWatch Alarms and these react to metrics. An alarm can either be in the okay or the alarm state, and these can be configured to generate notifications if the data which these alarms monitor breaches the normal level, and this is based on criteria which either you provide or the system detects as anomalous.
Basic Fundamentals of Amazon CloudWatch
There are some of the terms you need to understand before using CloudWatch:
1. Namespace = container for metrics
AWS use these for all the different AWS services, AWS services always start with AWS/, and the namespace which you create won’t.
Example: The EC2 namespace – AWS/EC2; The Lambda namespace – AWS/Lambda…
Namespace will help separate metrics from different services or applications with the same name, so namespaces act as containers.


2. Datapoint & Timestamp
A Timestamp represents the date and time when the value was taken.
Datapoint are the individual points of data that CloudWatch recorded and managed.

3. Metric = time ordered set of Datapoints

4. Dimension = name/value pair
Example of a metric has MetricName (CPUUtilization) and a Namespace (AWS/EC2/Per-Instance Metrics) to identify metrics, it would get pretty messy that we couldn’t separate datapoints for different EC2 instances.
So Dimension comes in really handy, it is a name/value pair which is provided when you add datapoints into CloudWatch, and is the way that the CPUUtilization metric for EC2 differentiate between instances.

Name/value pair in this sample is InstanceId/InstanceId Value
5. Statistic = aggregation over a period
This is the way that you can take data which occurs over a period and aggregate it in a certain way.
For example, we have 60-second resolution for CPUUtilization and we want to view the Min, Max, Average values over five-minutes periods, then you can do that using statistics.
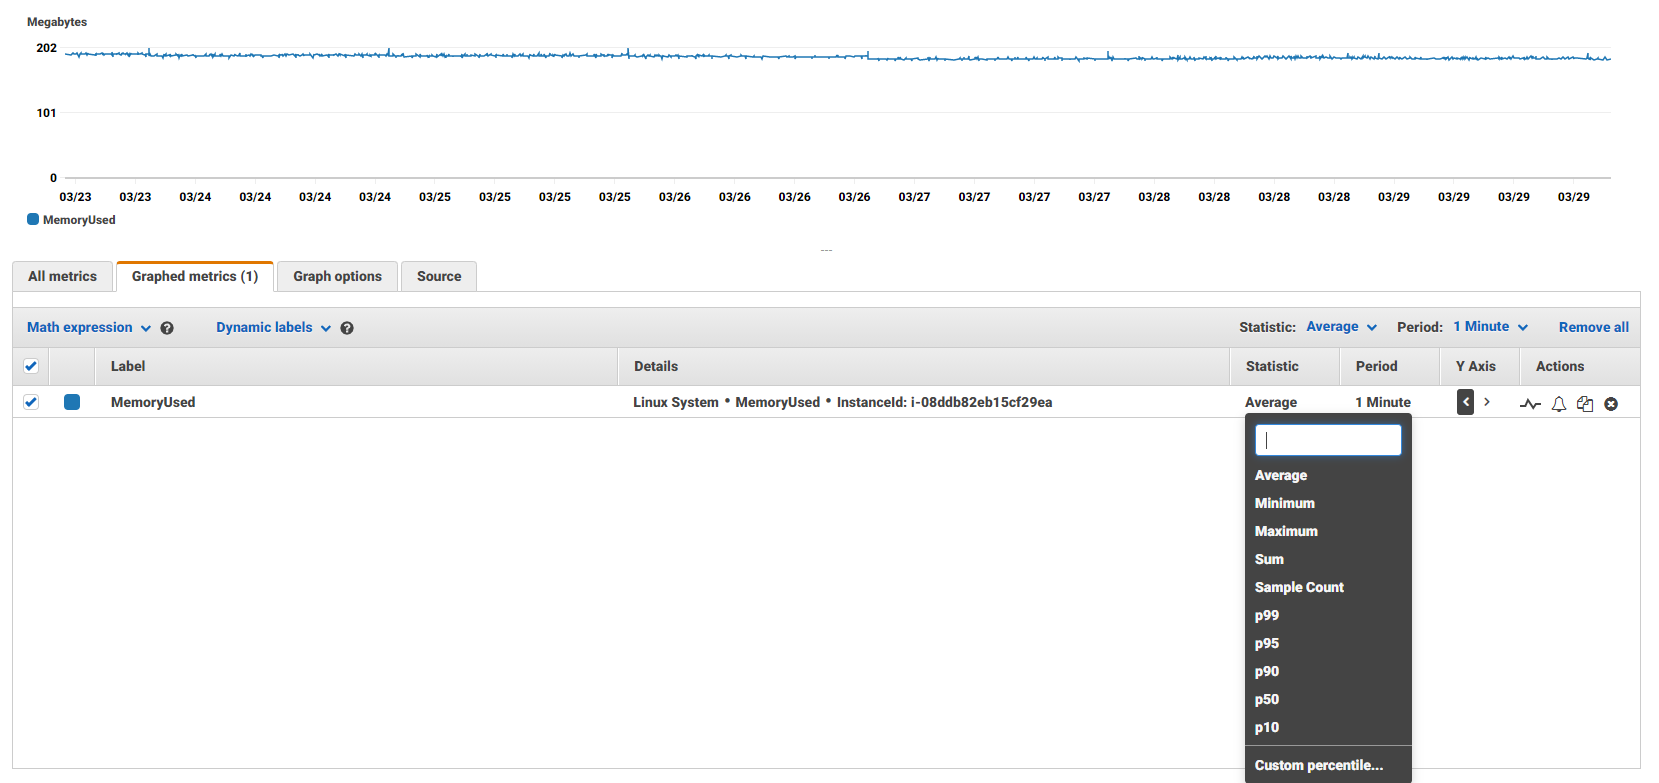
6. Percentile = the relative standing of a value
The percentile indicates the relative standing of a value in a dataset. If we have 95th percentile, this mean that 95% of the data is lower than this value, and 5% is higher than this value. It provide better understanding of the distribution of your metric data and help us eliminate outliers.

Now when you publish datapoints into CloudWatch, you do so with a certain resolution. Metric produced by AWS services use standard resolution, they have a 60-second granularity.
CloudWatch retains data for a certain period of time, for the resolution:
-
less than 60s, the data is retained for 3 hours
-
more than 60s,the data is retained for 15 days
-
more than 300s, the data is retained for 63 days
-
more than 3600s, the data is retained for 455 days
We can see that as data ages (455 days), the detail matters less and less (>3600s). And it would be more expensive if the resolution getting lower (<60s).
In Part 1 of this topic, we discussed some basic concepts of Amazon CloudWatch that we need to know before get your hand on this service in Part 2 with VTI Cloud.
Amazon CloudWatch Introduction (Part 2) | VTI CLOUD
About VTI Cloud
VTI Cloud is an Advanced Consulting Partner of AWS Vietnam with a team of over 50+ AWS certified solution engineers. With the desire to support customers in the journey of digital transformation and migration to the AWS cloud, VTI Cloud is proud to be a pioneer in consulting solutions, developing software, and deploying AWS infrastructure to customers in Vietnam and Japan.
Building safe, high-performance, flexible, and cost-effective architectures for customers is VTI Cloud’s leading mission in enterprise technology mission.
