On AWS, with basically any EC2 instance using Amazon CloudWatch, you can access default metrics and monitor the CPU, Network, Disk usage (I/O, not the available hard disk space), and status of the individual virtual machine. What you can’t monitor with default metrics, however, is RAM Utilization (or Storage of virtual disks). This is instead executed using custom metrics, and in this article, we’re going to find out how to install a custom metric on our EC2 instance.
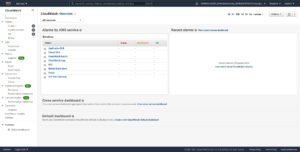
Take a look back at Amazon CloudWatch
As mentioned in the article: Amazon CloudWatch Introduction (Part 2) | VTI CLOUD
Standard monitoring is every 5 minutes and Detailed monitoring is every 1 minute.
The key idea here is to create a custom metric that transfers data to Amazon CloudWatch every minute.
How to create Custom Metrics of Amazon CloudWatch
Firstly, you would need to log into the AWS console, select the region, provide an EC2 instance and send some custom metrics up to Amazon CloudWatch.
In order to do that, we need permission to talk to Amazon CloudWatch so we need to:
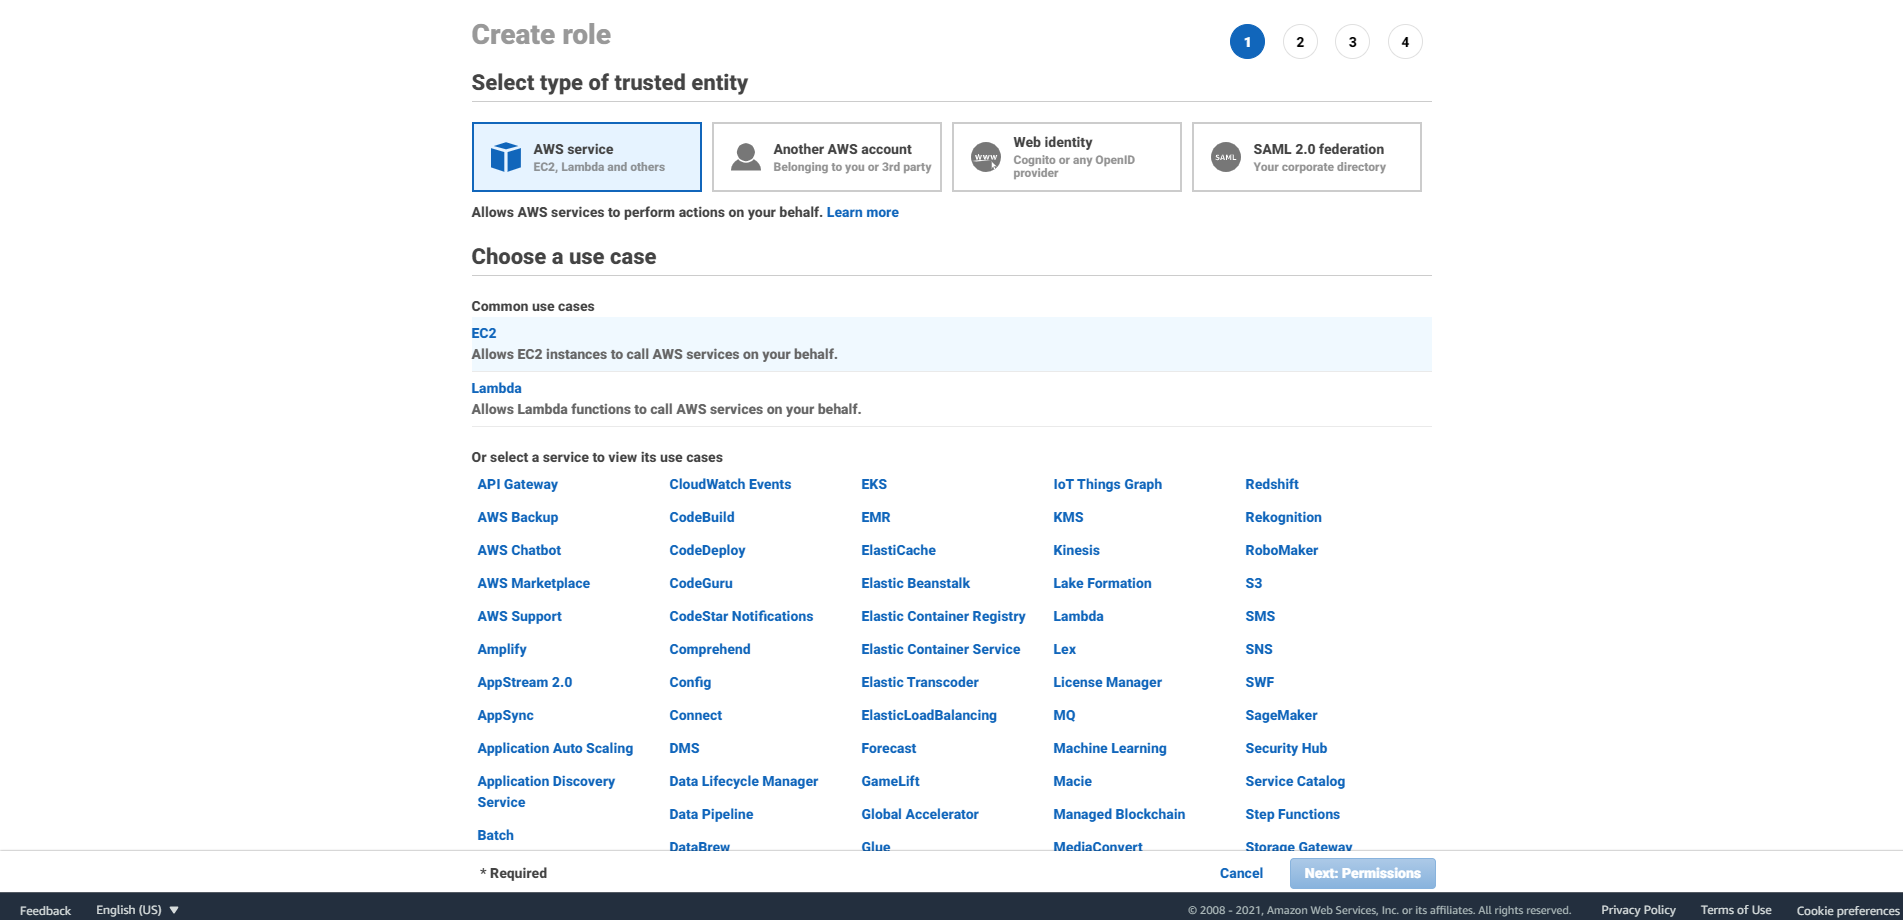
A. Create a Role for EC2 Instance
-
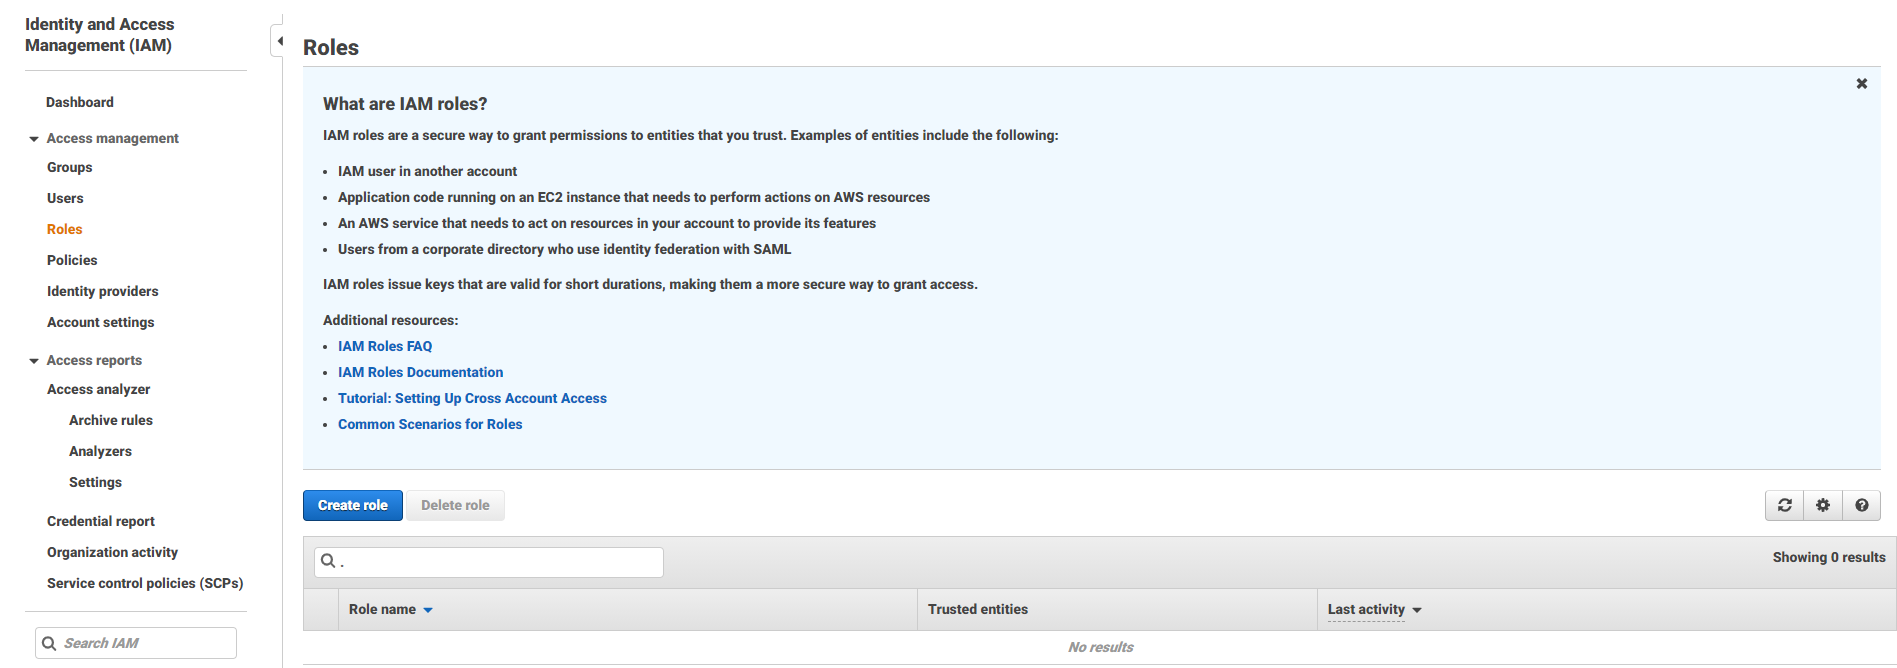
Go over to Identity Access Management (IAM).
-
Go to Roles and create a new one.
-
The service that’s going to use this role is EC2, go ahead and hit Next.
-
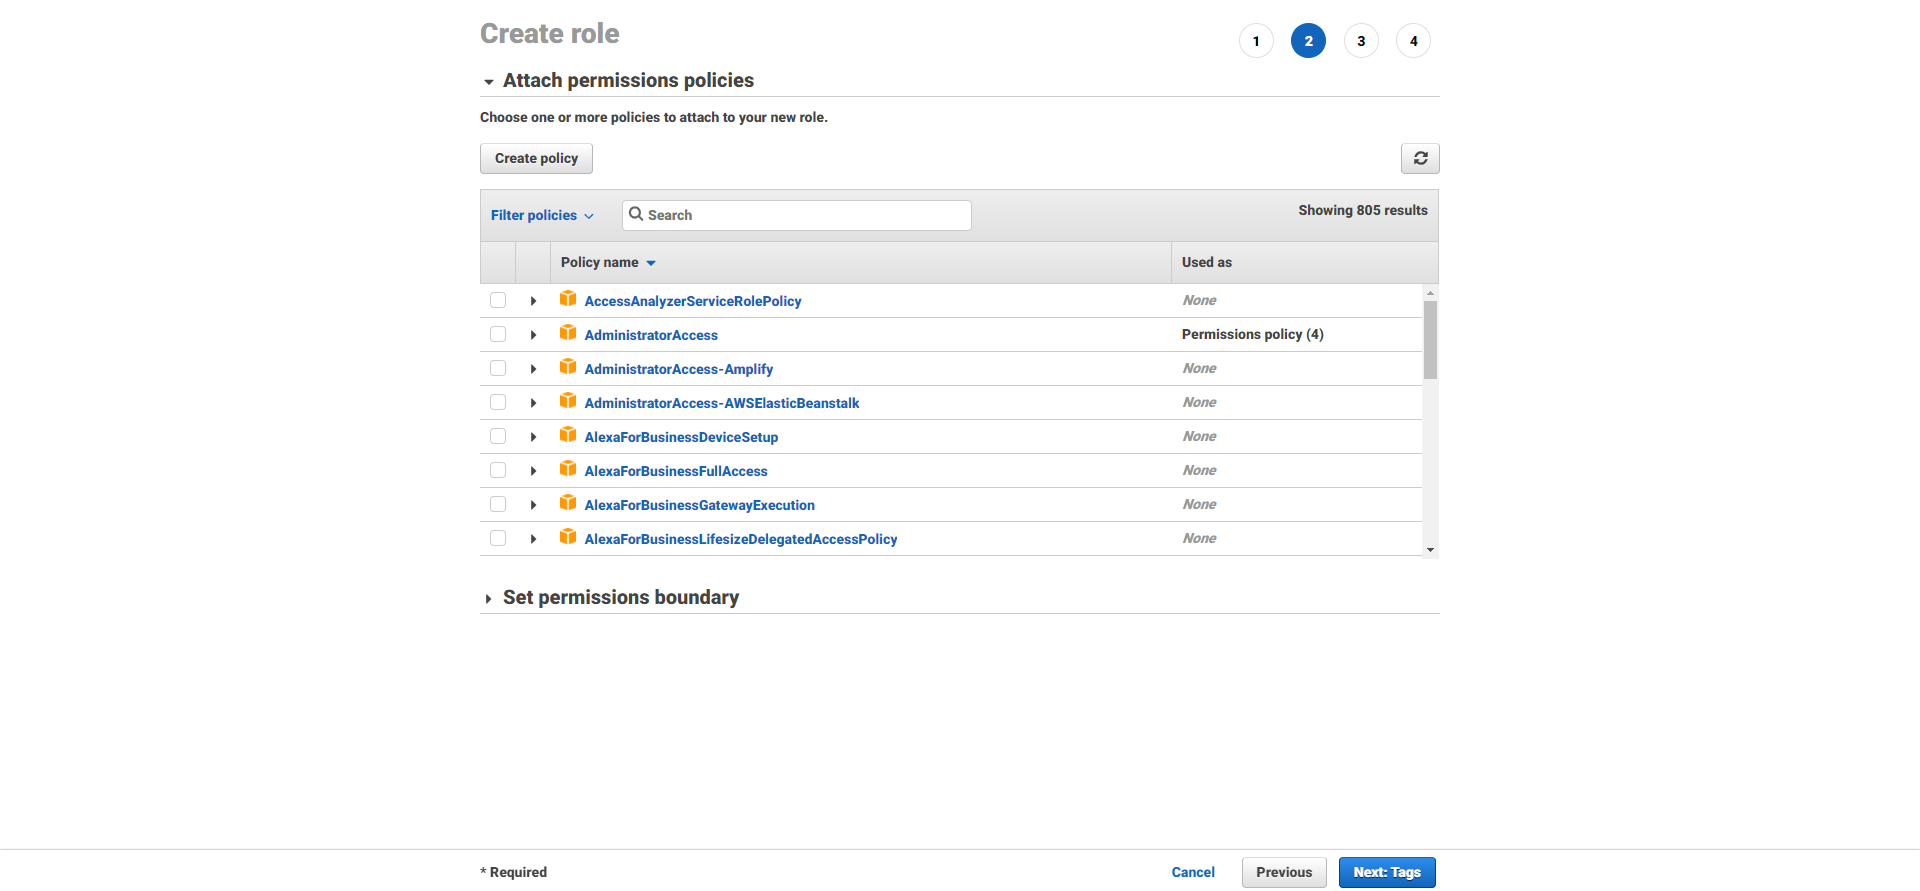
Choose ‘Create Policy’
-
On Create Policy page, choose JSON tab and complete the following fields and move to the next step.
"Version":“2012-10-17”,"Statement":"Action":"“cloudwatch":"PutMetricData”","“ec2":"DescribeTags”"],"Effect":"Allow","Resource":"*"]}]}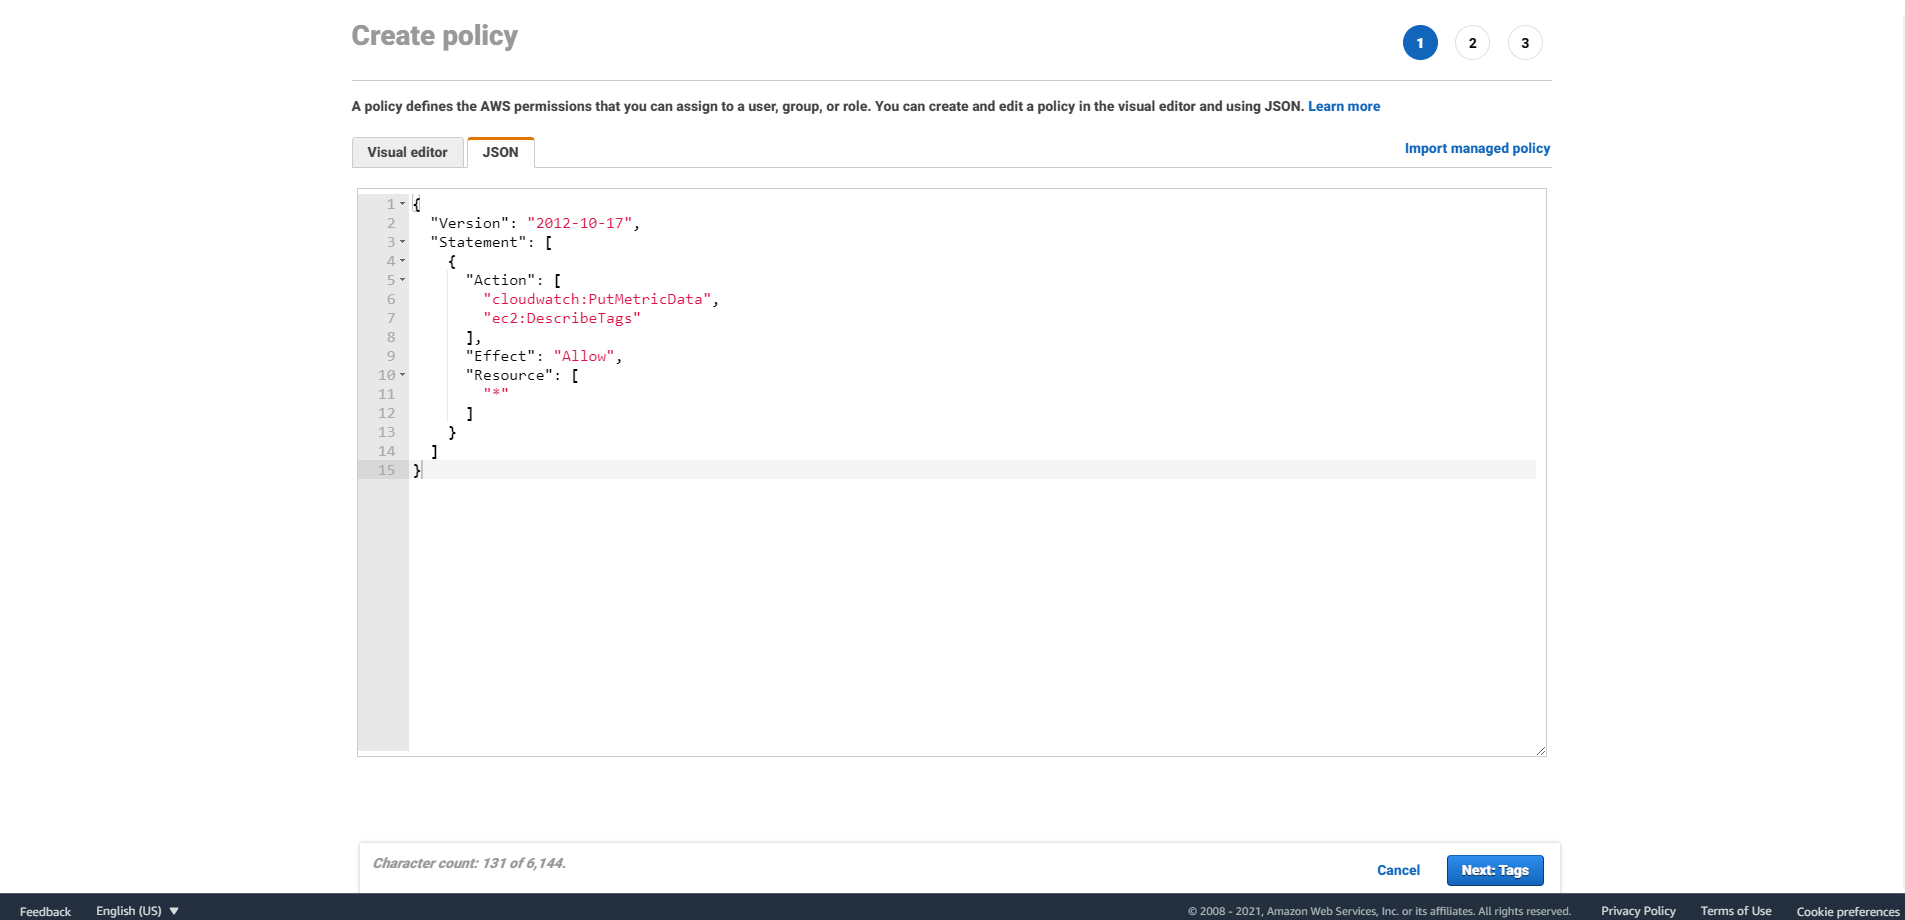
-
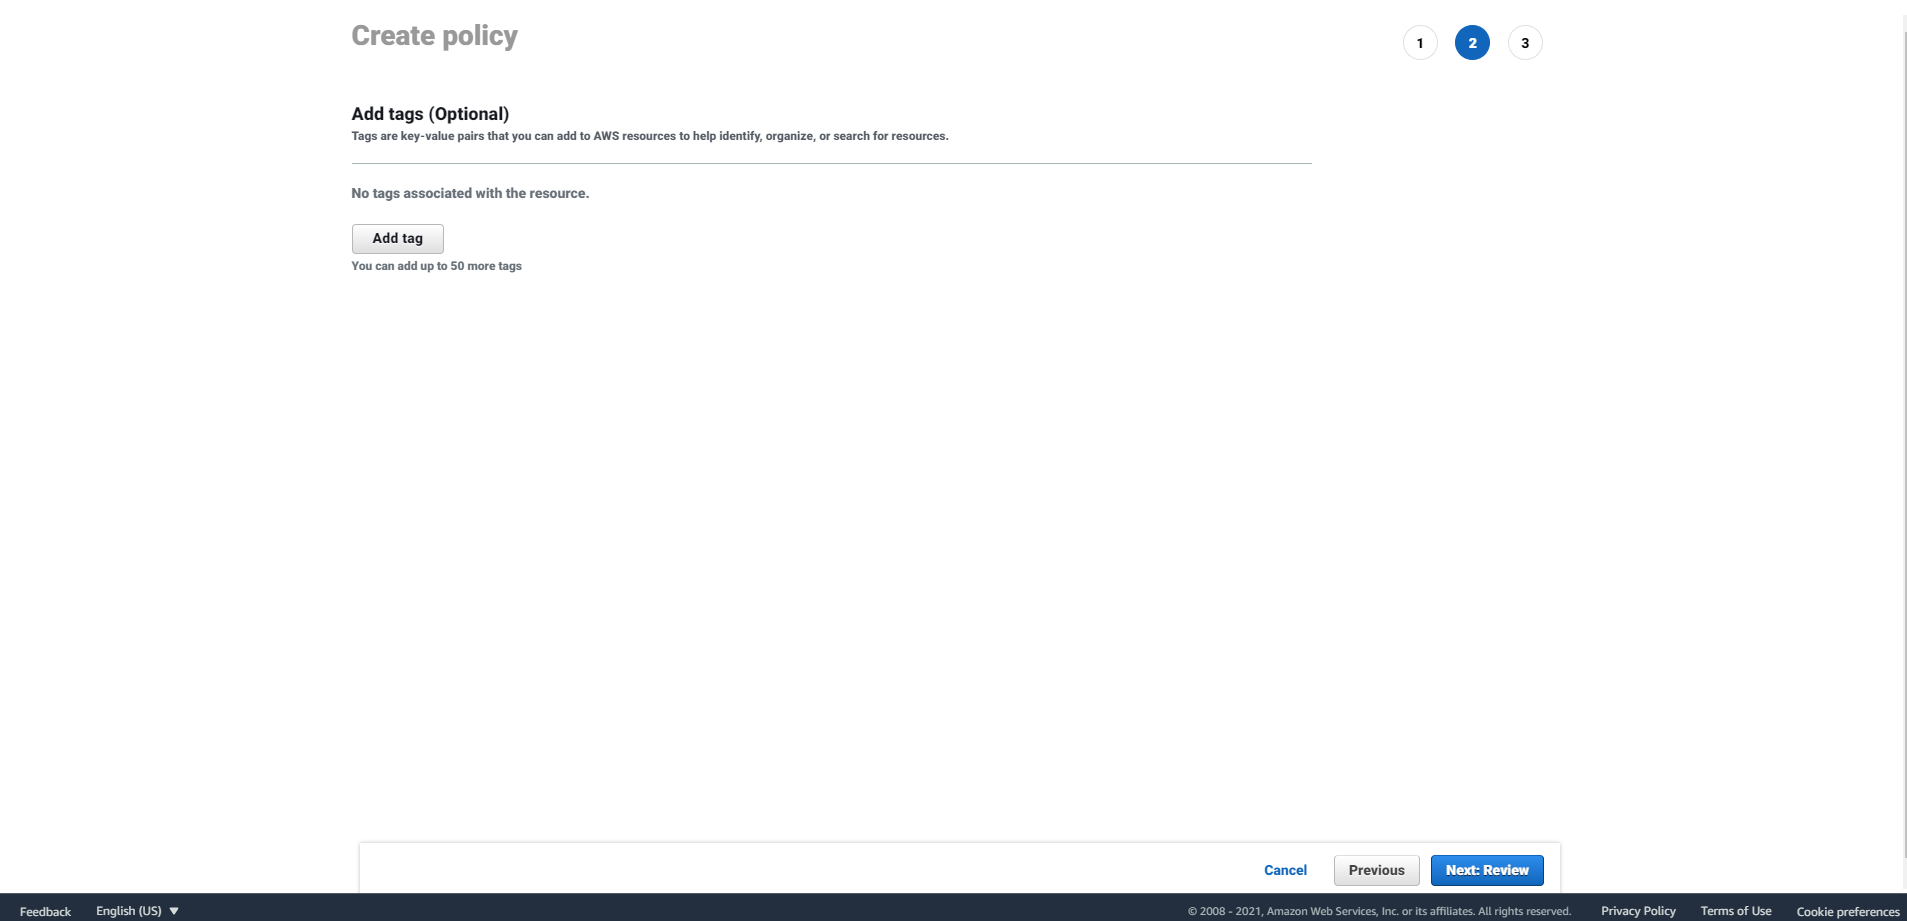
Add tags if you’d like to and hit next to the review the whole Policy.
-
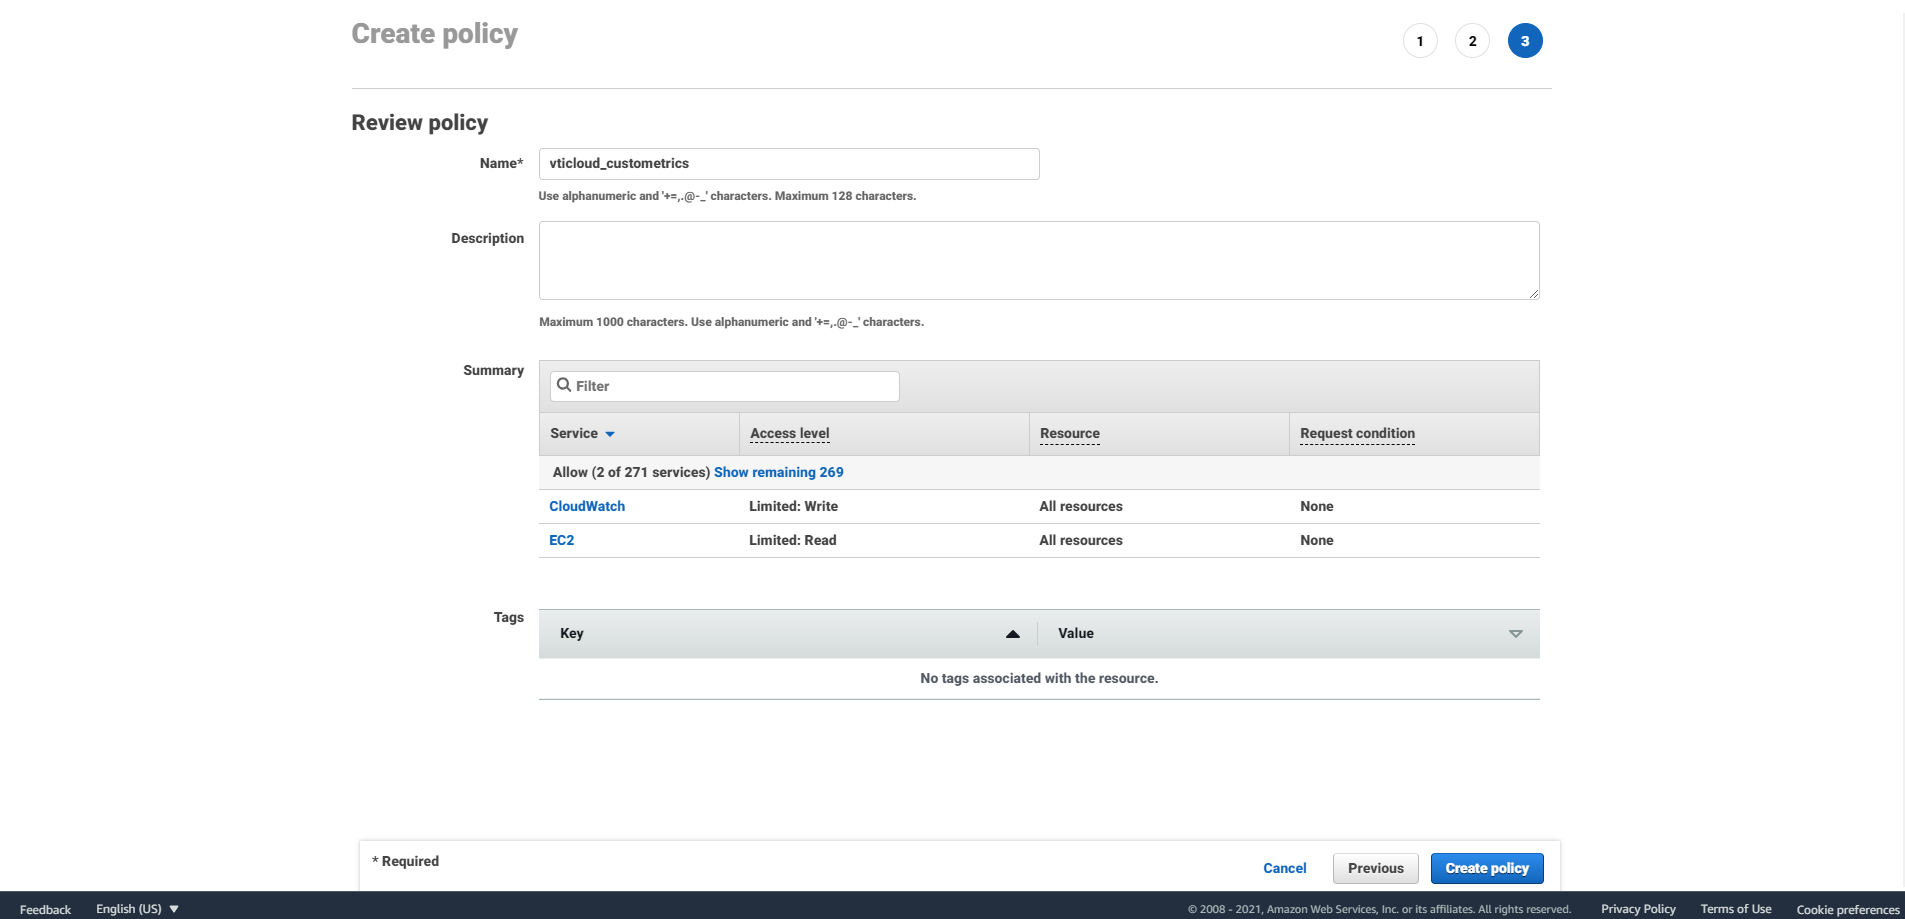
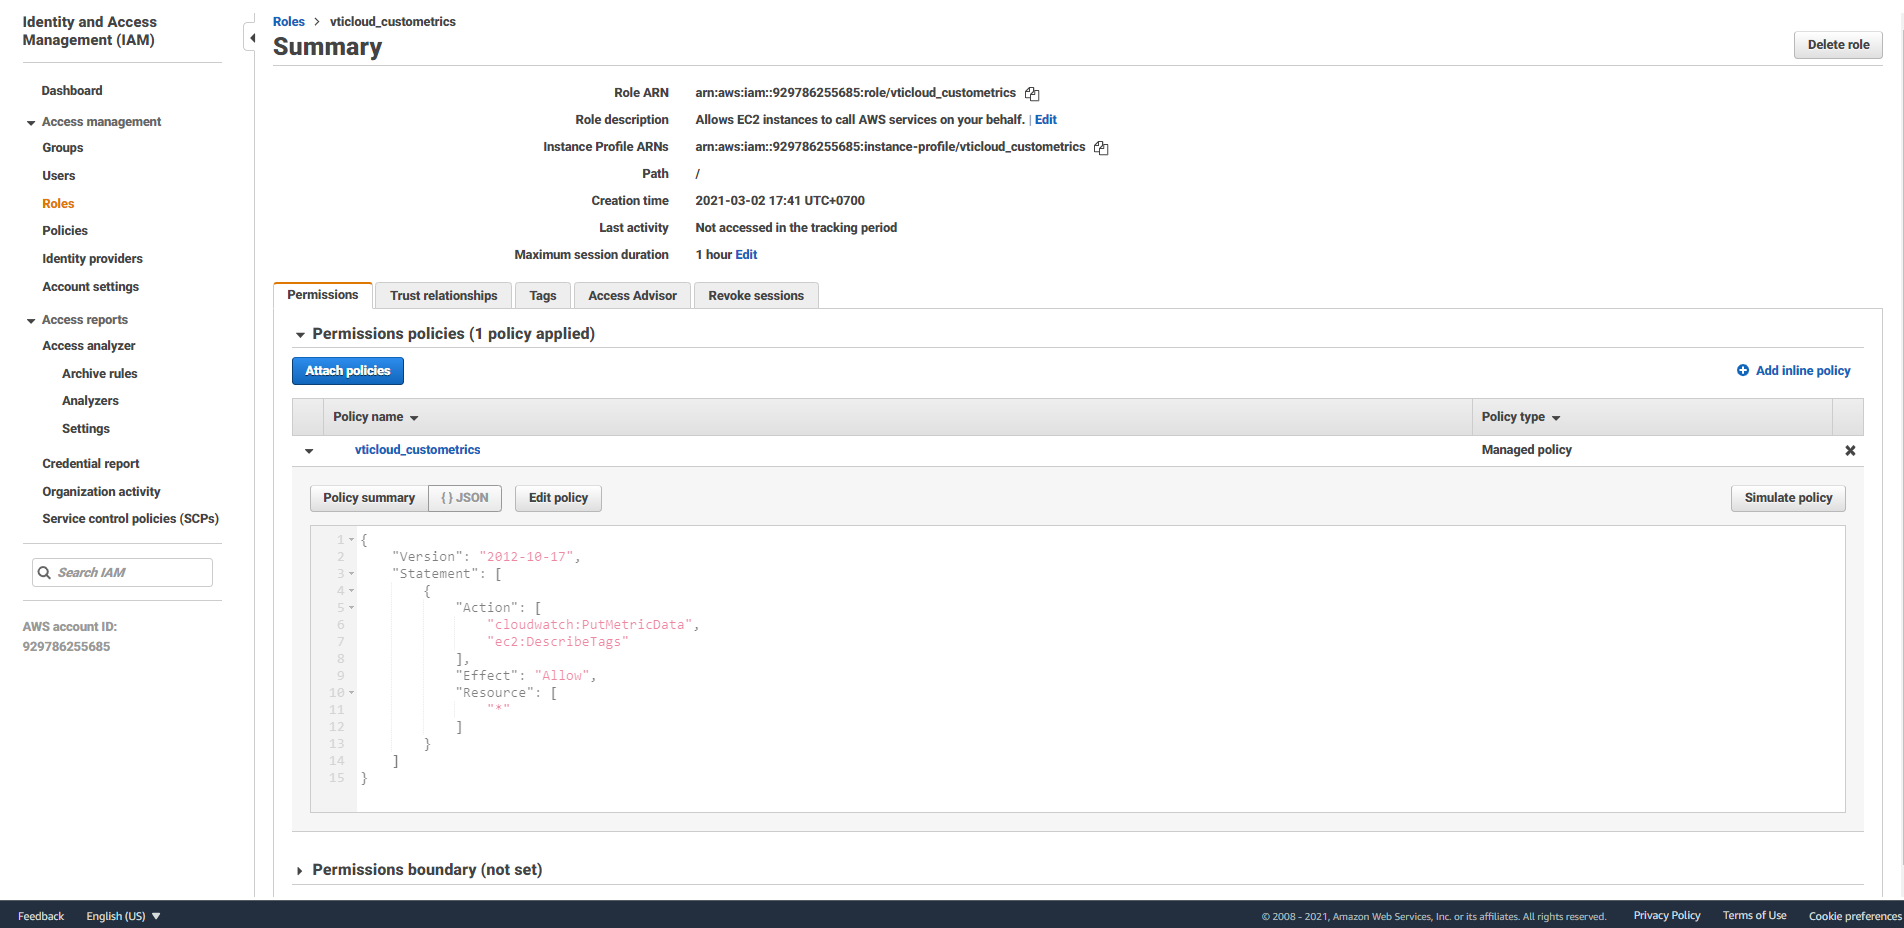
The final step to create a Policy is choose a Policy name and Create Policy. You can also take a look at the policy’s permissions on the Summary table.
-
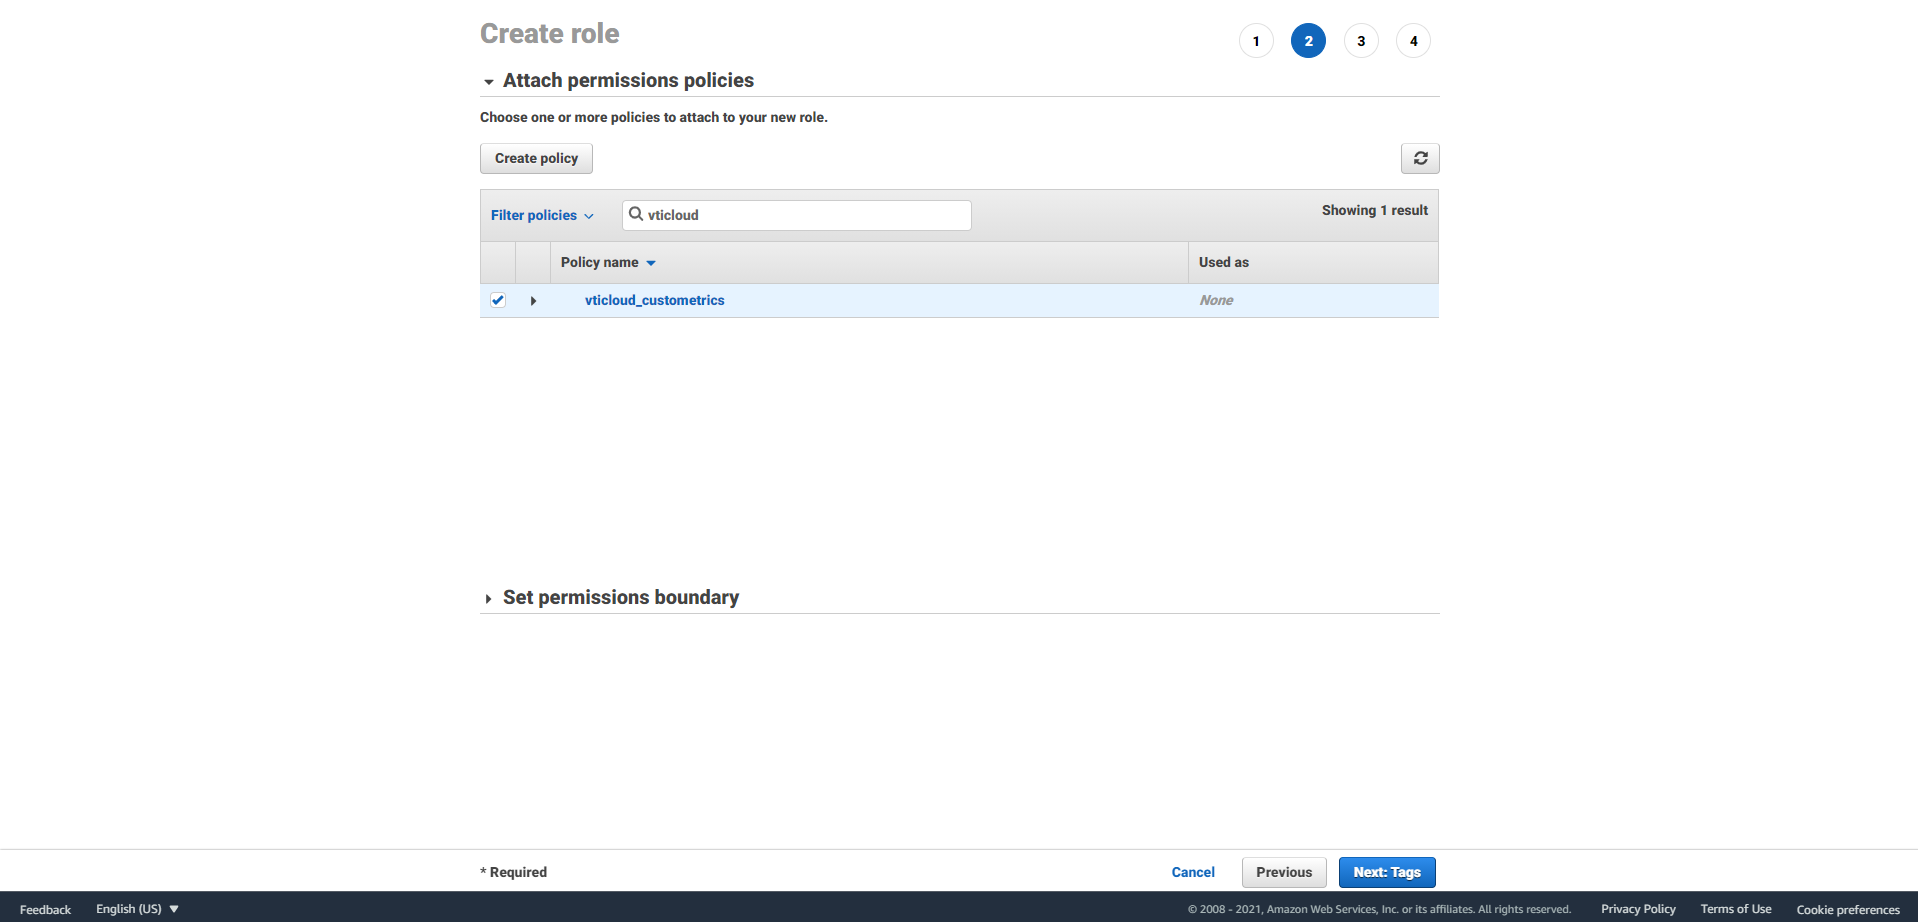
After the notification of successfully created a Policy, go back to the Create Role page and hit refresh button on the top right, search for the name of the Policy you have created, tick on the box and hit next to attach that Policy to the Role.
-
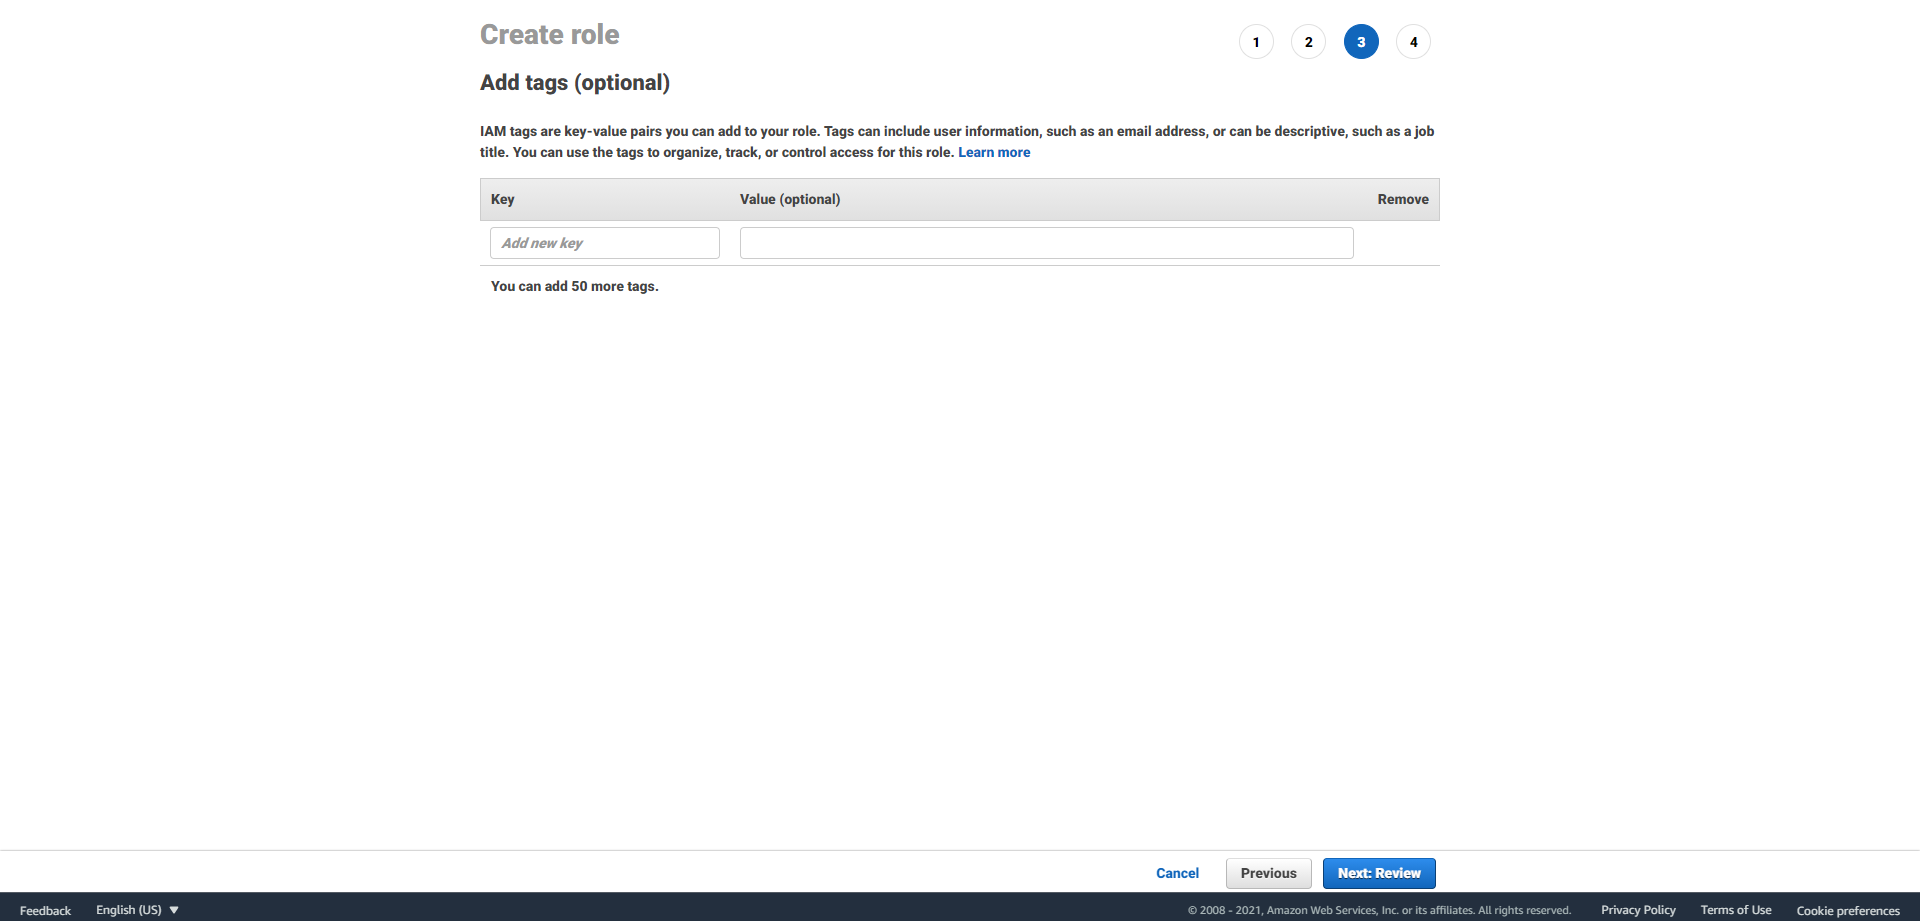
Add tags if you’d like to and hit next to the review the Role.
-
Choose a Role name, describe the Role function and hit Create role.
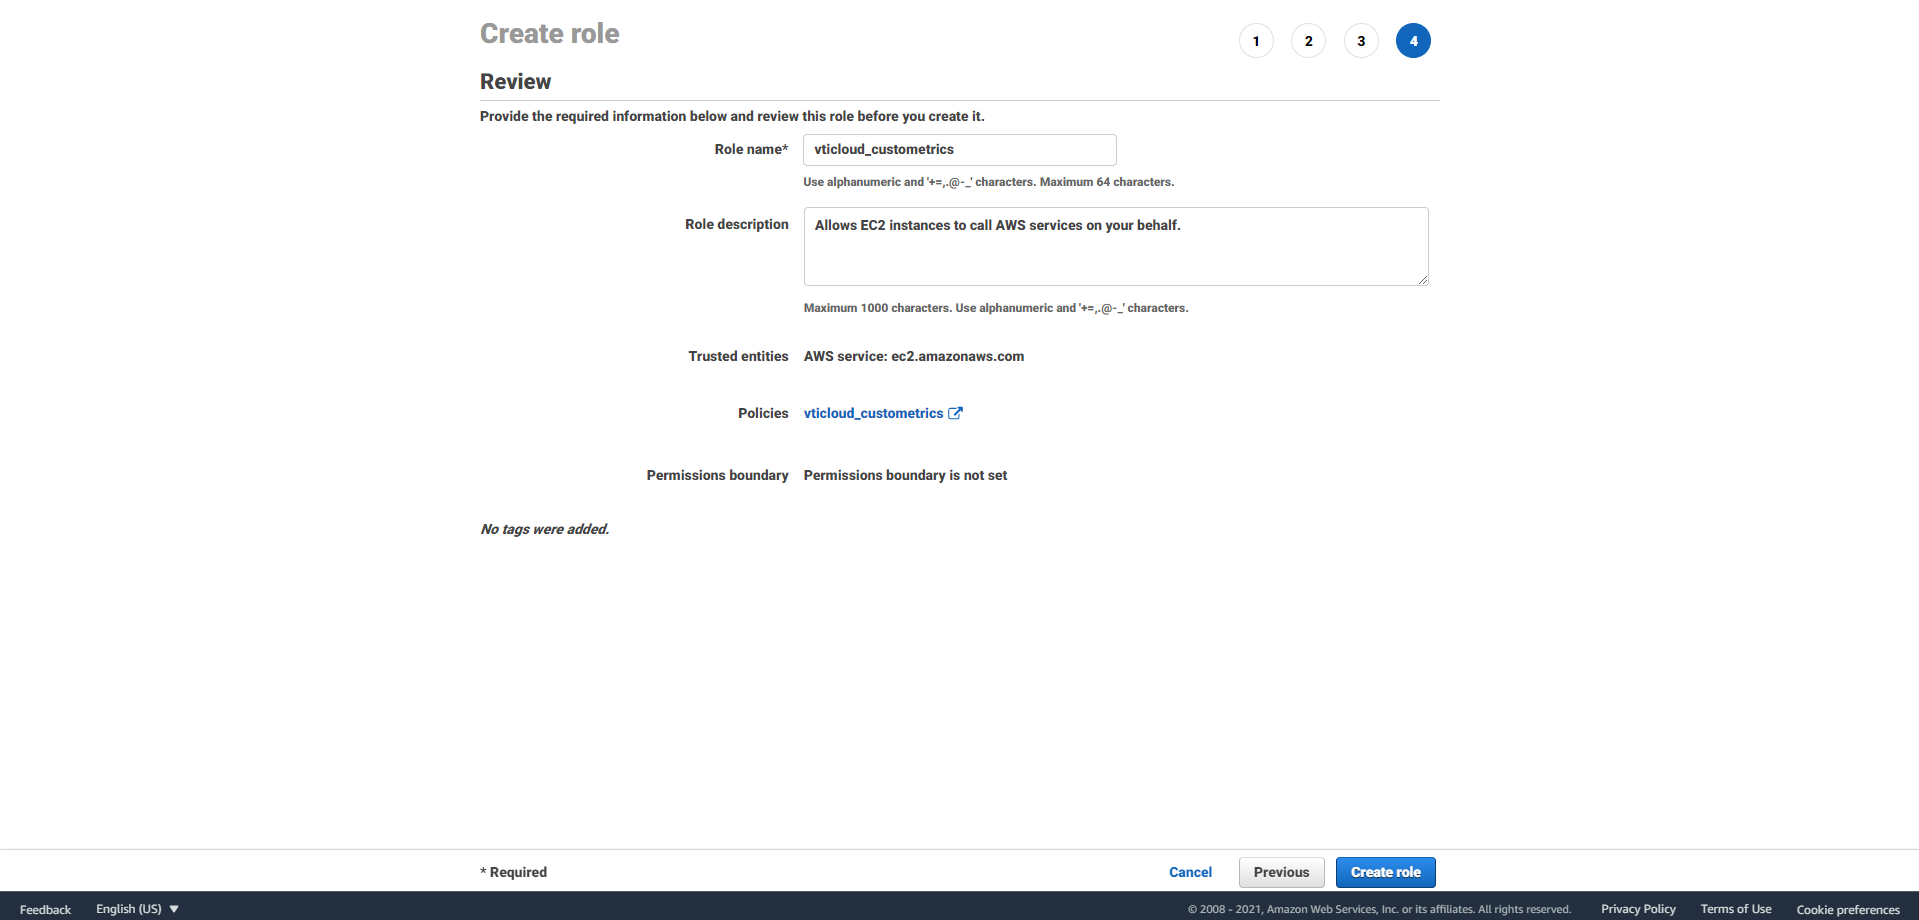
We’ve created a Role and you can find it here at IAM,Roles, it’s gonna be pretty basic JSON.
B. Attach the Role you have created to an EC2 Instance
Next, we will take additional steps to attach that Role to your EC2 Instance, and push the metrics to Amazon CloudWatch.
-
Go over to the EC2 console and provision a EC2 Instance
-
Chọn Amazon Linux 2 AMI
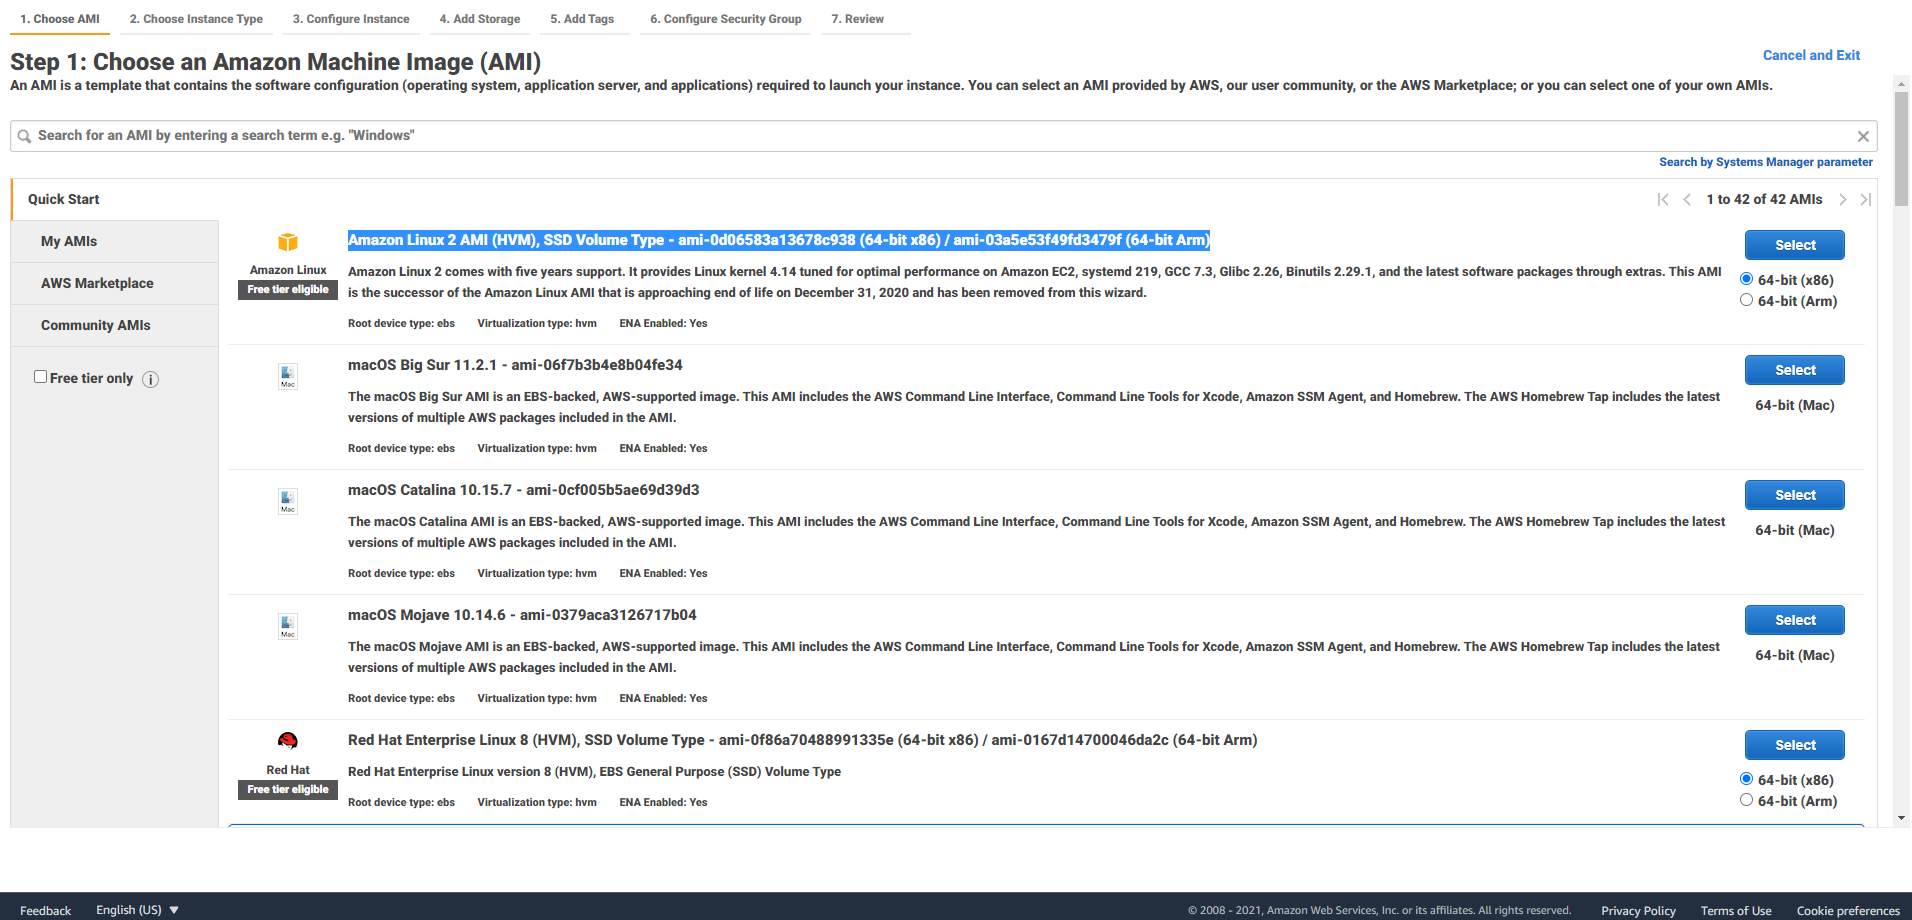
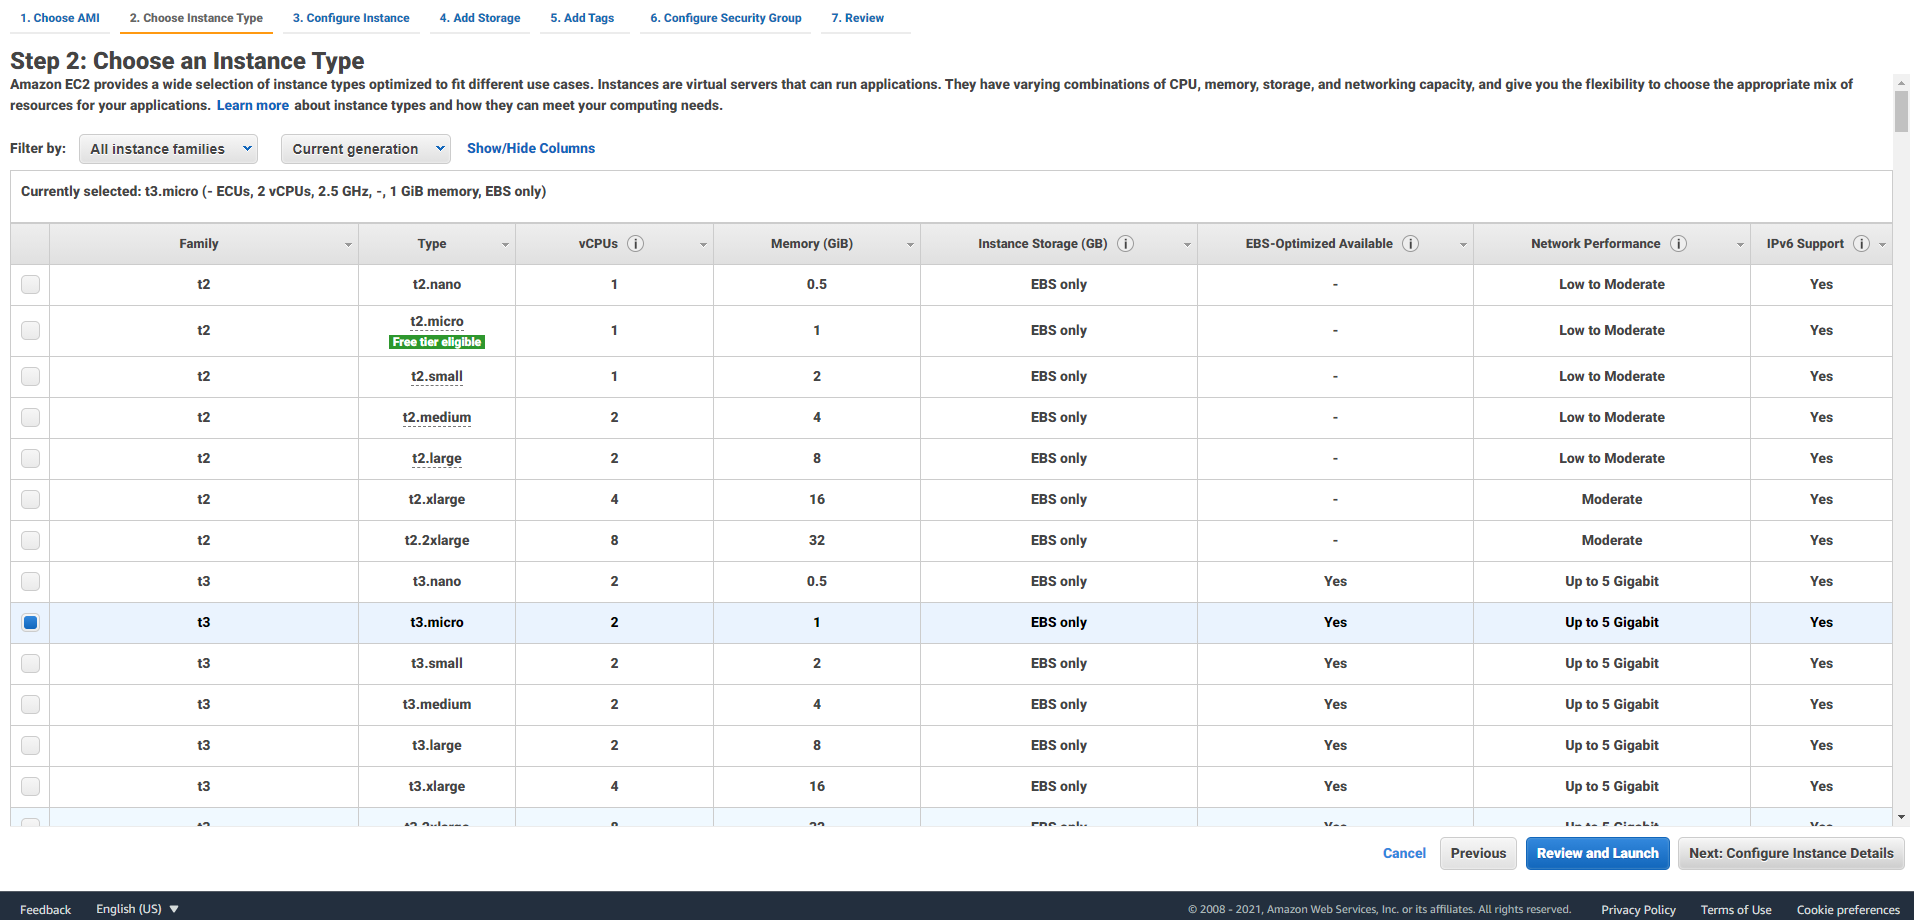
-
Choose Instance Type, hit next
-
In Configure Instance Details, IAM Role, choose the Role you’ve just created
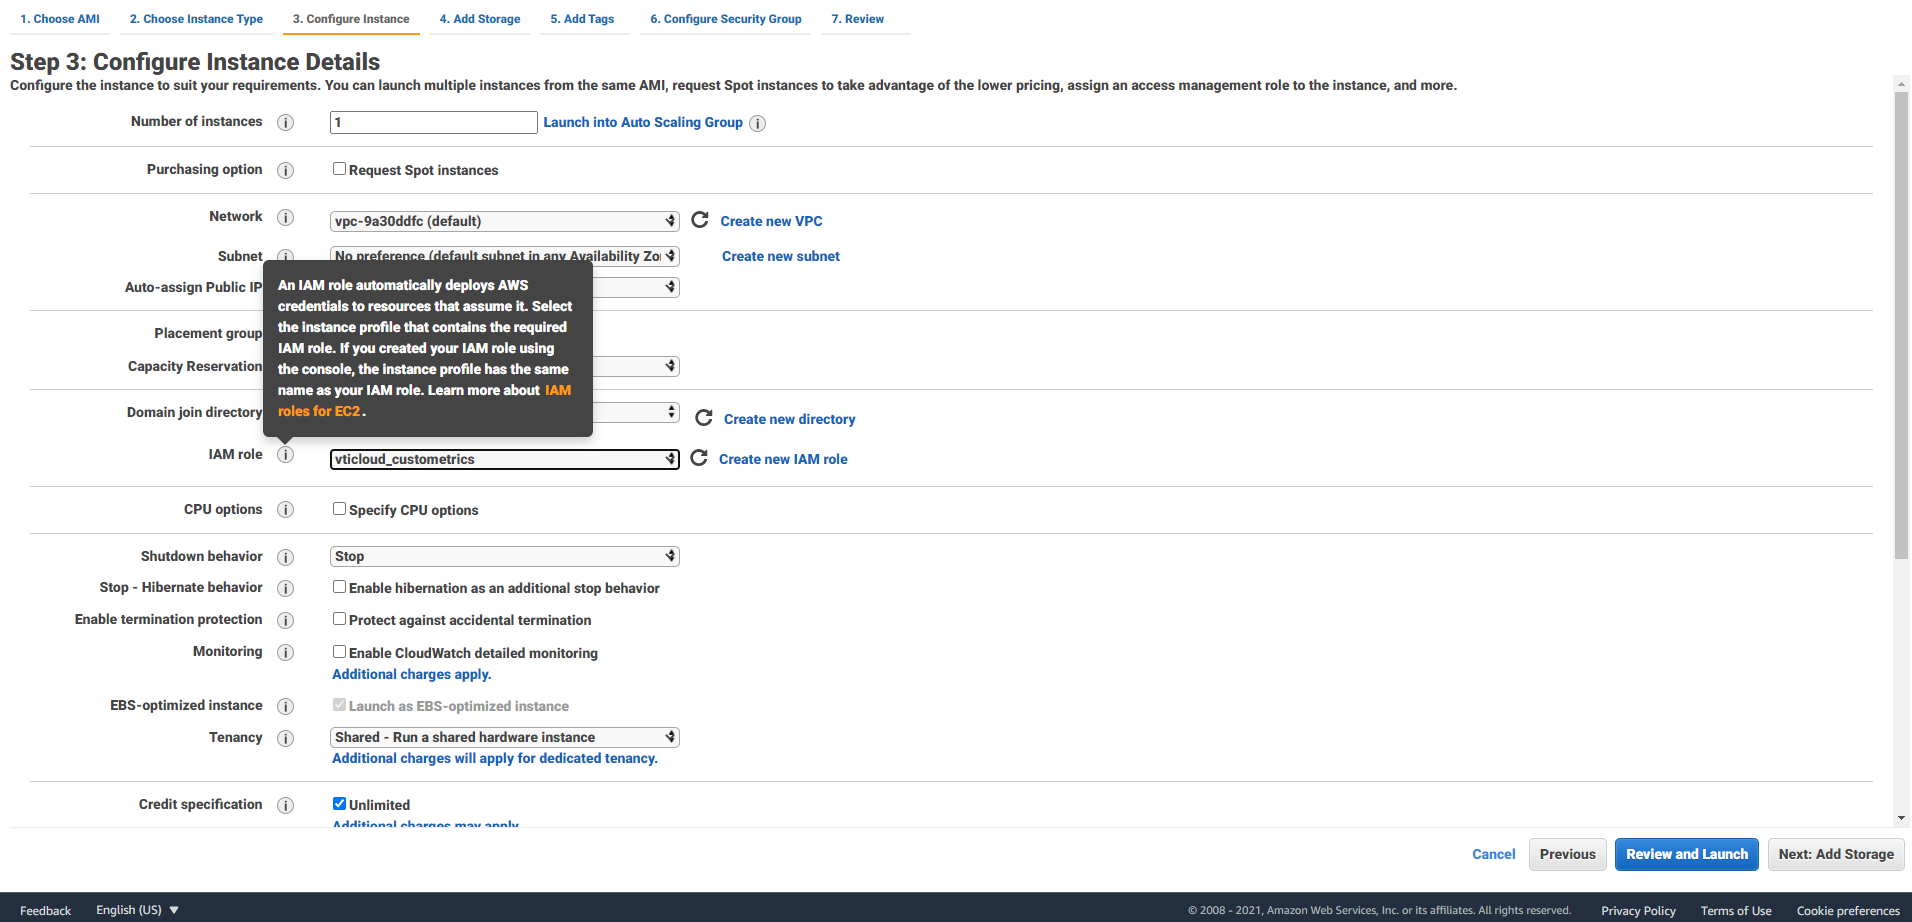
In Advanced Details, User data, we’re going to run a bootstrap script provided bellow.
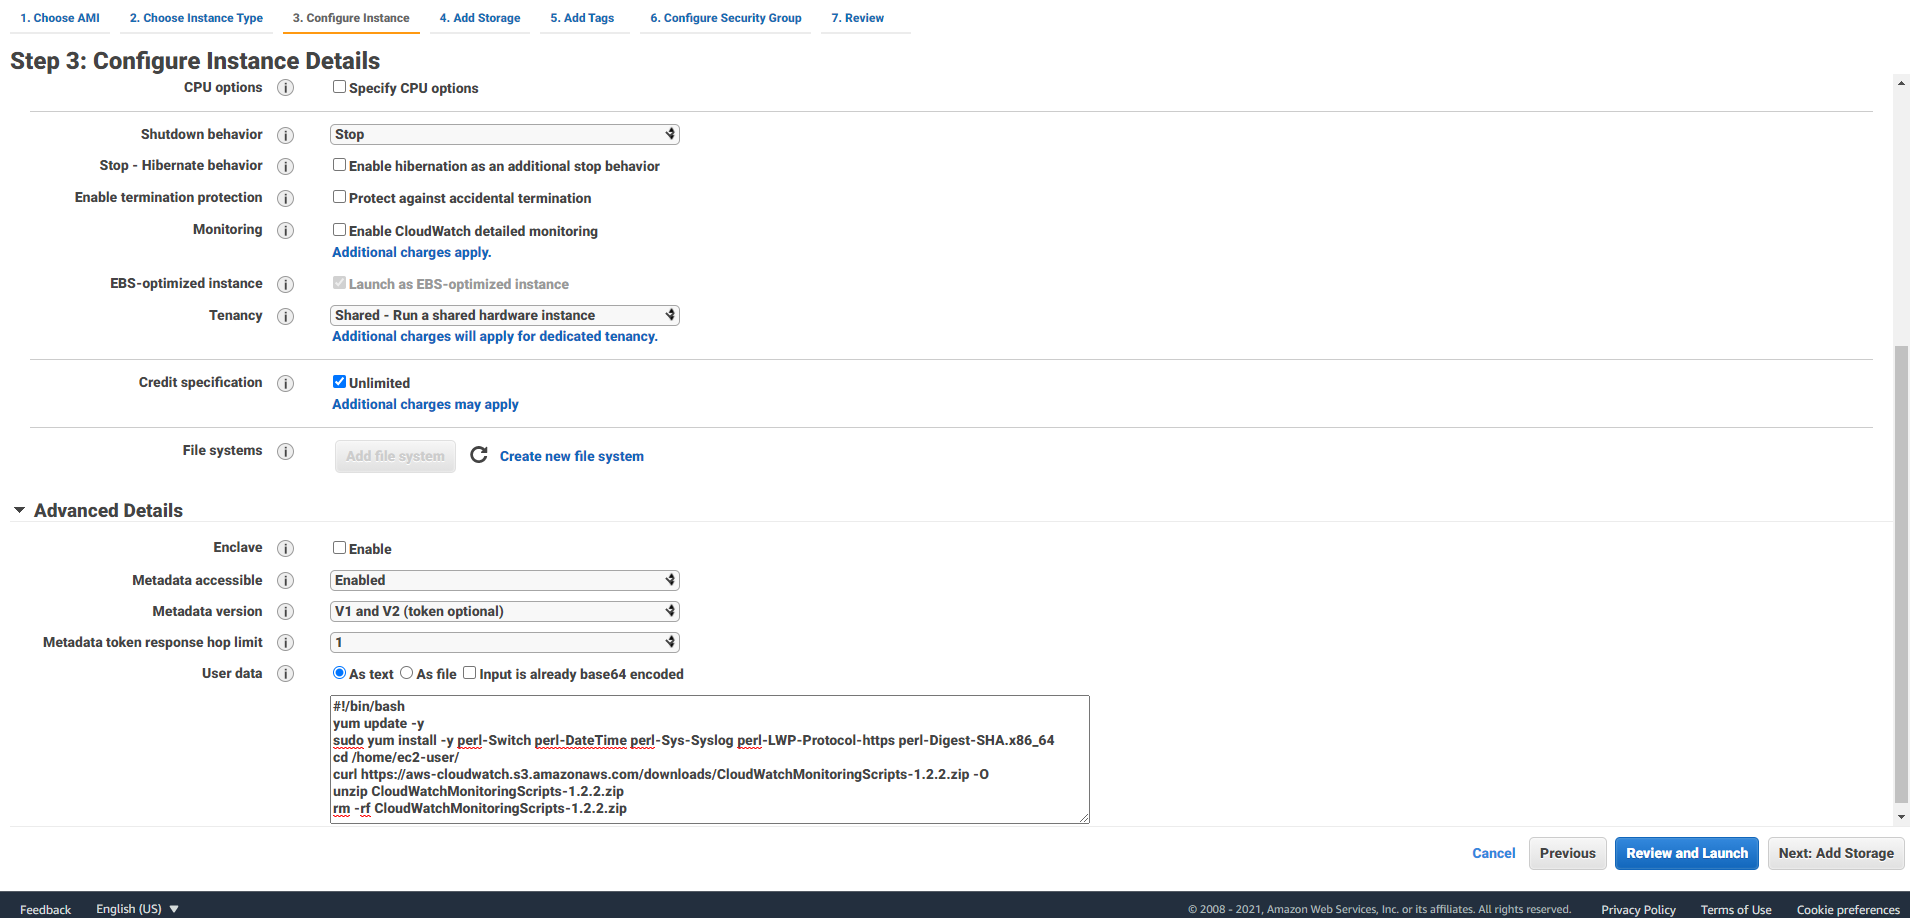
#!/bin/bashyum update -ysudo yum install -y perl-Switch perl-DateTime perl-Sys-Syslog perl-LWP-Protocol-https perl-Digest-SHA.x86_64cd /home/ec2-user/curl https://aws-cloudwatch.s3.amazonaws.com/downloads/CloudWatchMonitoringScripts-1.2.2.zip -Ounzip CloudWatchMonitoringScripts-1.2.2.ziprm -rf CloudWatchMonitoringScripts-1.2.2.zipLet’s look at what does this script do:
Firstly, it is updating the EC2 Instance with all the security patches
Secondly, it is installing a bunch of different Perl services and then changing the directory over to /home/ec2-user/
Finally, it is downloading the Amazon CloudWatch monitoring scripts, and unzipping it and deleting the zip file.
-
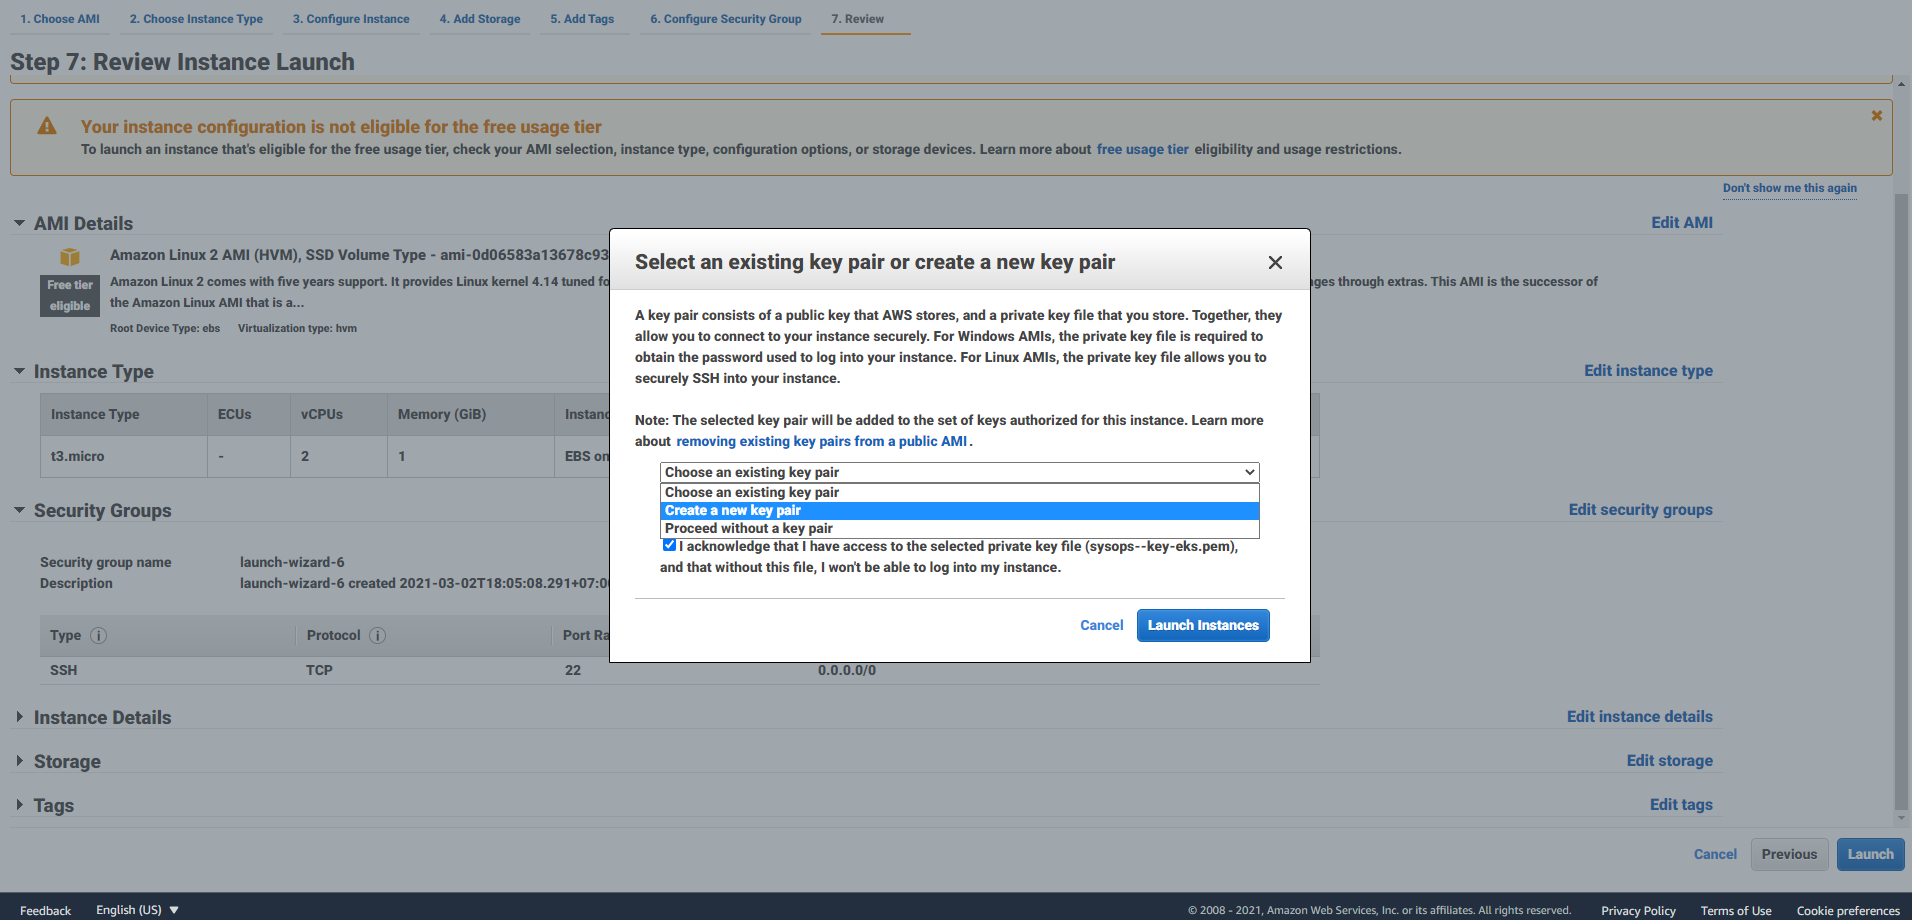
Config the Storage, Tags and Security Group or just leave it as default, Hit ‘Review and Launch’, download or use your existing Key pair and launch the Instance
-
Ssh to the Instance.
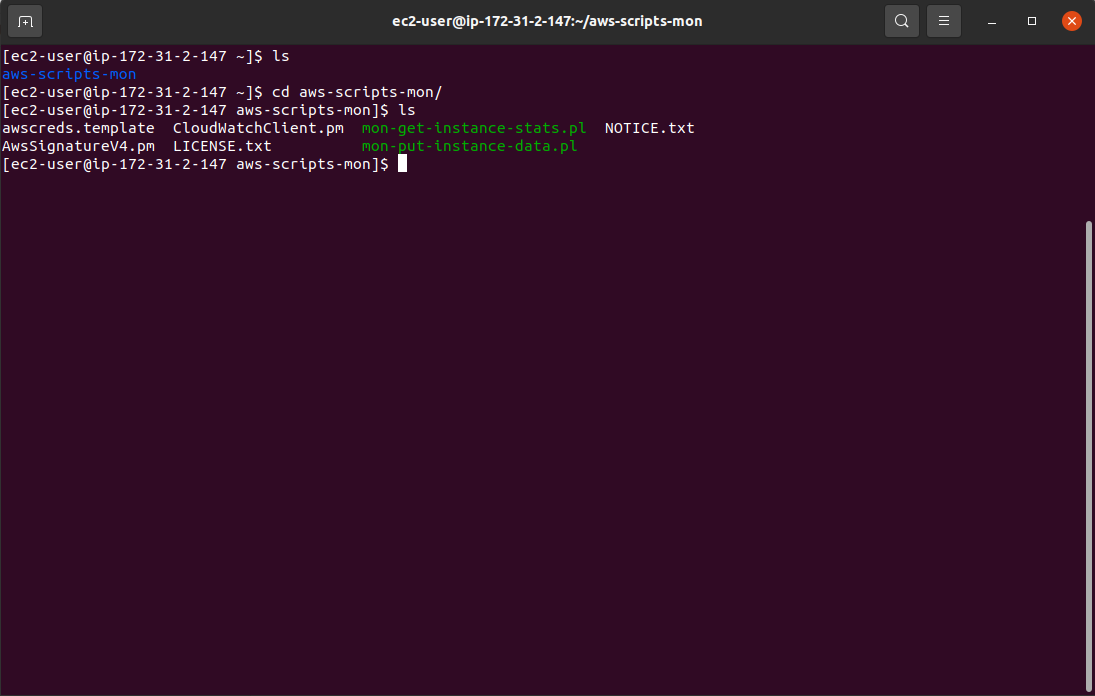
In the terminal, type in ‘ls’ and we can see the directory is there. That is what the bootstrap script has unzipped and installed.
Go inside that directory, we can notice two files in here: mon-get-instance-stats.pl and mon-put-instance-data.pl
To send some data to Amazon CloudWatch, we’re going to use the command:
sudo /home/ec2-user/aws-scripts-mon/mon-put-instance-data.pl --mem-util --mem-used --mem-avail --disk-space-util --disk-space-avail --disk-path=/
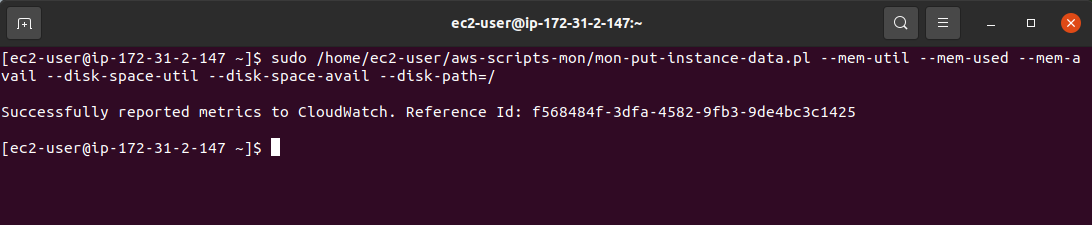
For this command, we’re gonna send our memory utilization, used, and available data; also our disk space utilization and available.
And you are able to see that it says successfully reported metrics to Amazon CloudWatch, and the Reference Id.
It can take up to 1 minute for this to appear on the Amazon CloudWatch console.
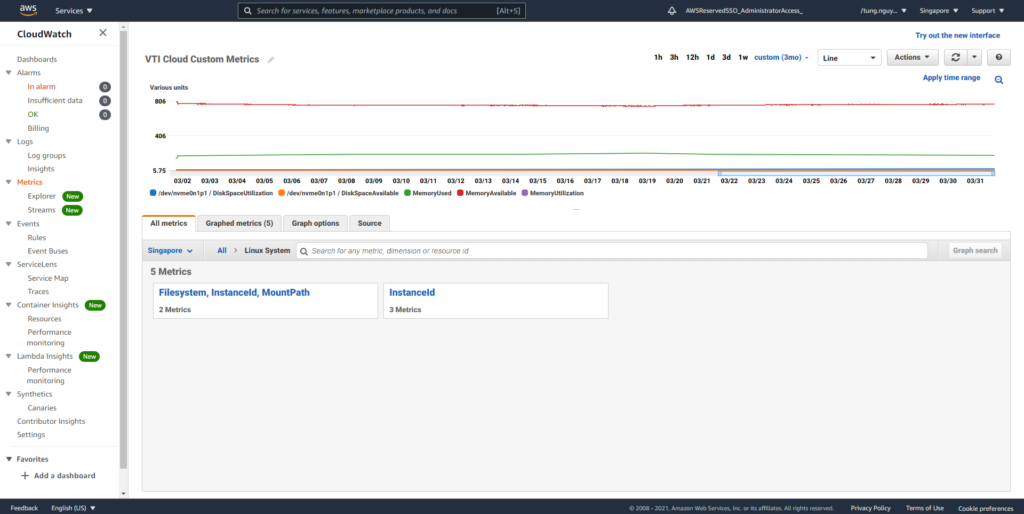
For Custom Metrics, we call data having a one-minute granularity is Standard Resolution.
Now we can see a new metric under Custom Namespaces called Linux System, and five new metrics inside for your insance: MemoryUtilization, MemoryAvailable, MemoryUsed, DiskSpaceUtilization, and DiskSpaceAvailable.
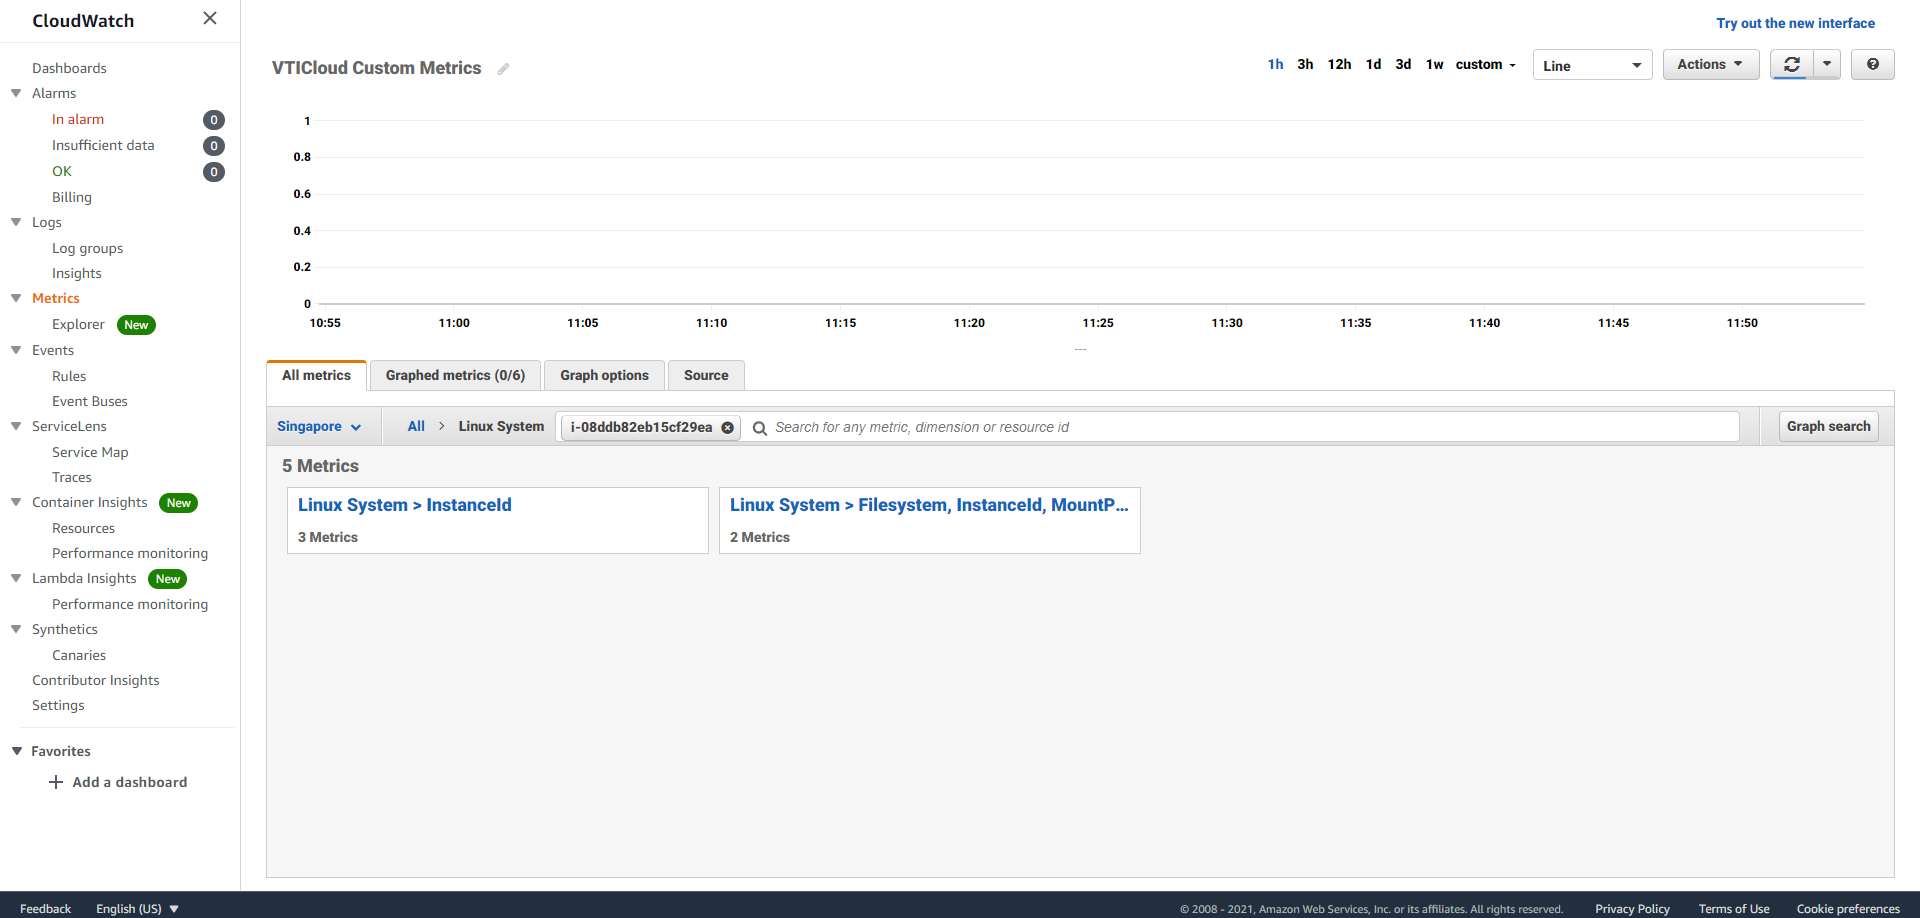
You will see only a single data point at the beginning because we’ve only pushed this information into Amazon CloudWatch once.
What we are going to do is push it in every 1 minute. To do this, you need to edit your crontab file:
sudo nano /etc/crontab
and put this command into your crontab
*/1 * * * * root /home/ec2-user/aws-scripts-mon/mon-put-instance-data.pl --mem-util --mem-used --mem-avail --disk-space-util --disk-space-avail --disk-path=/
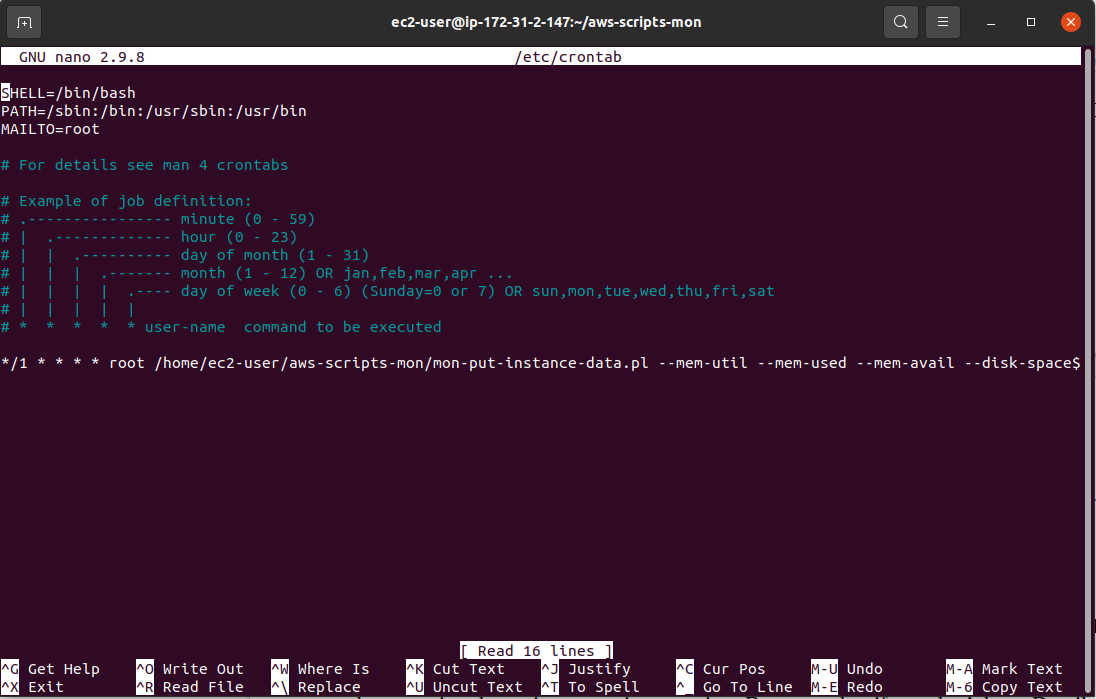
By pasting this in here, we’re going to run this command every minute as root and put the information up into Amazon CloudWatch.
Basically you can set it to run a command every minute, every day, week, or month.
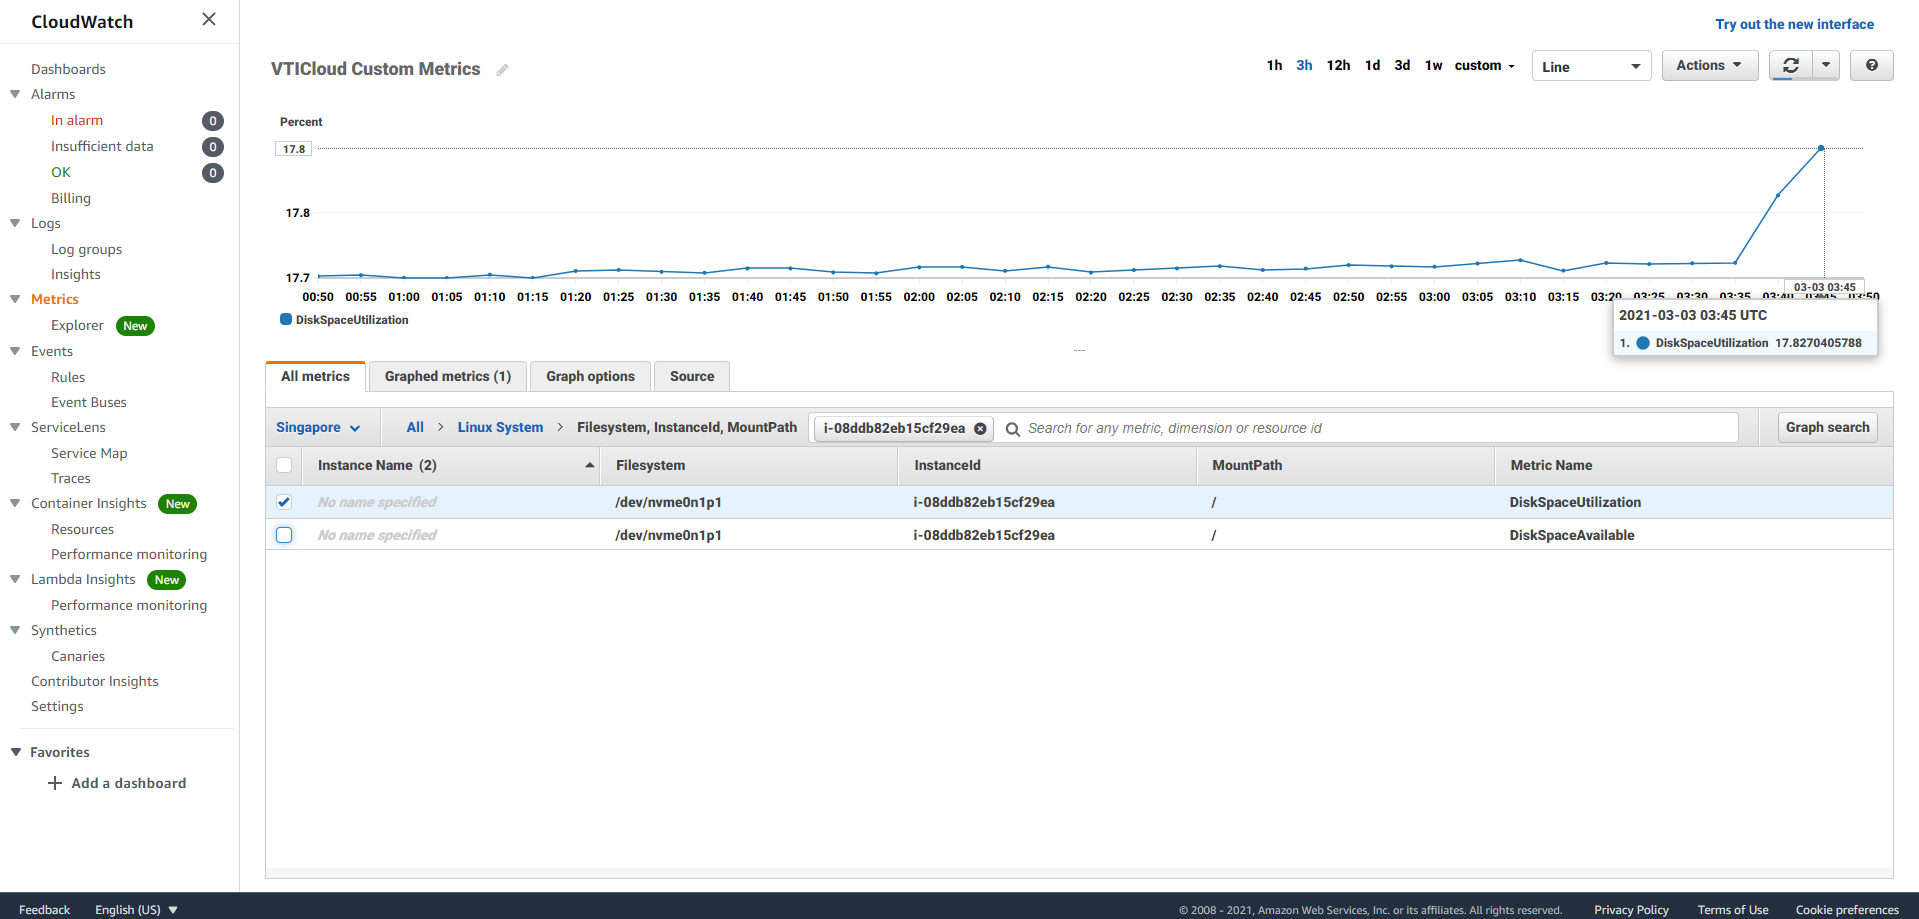
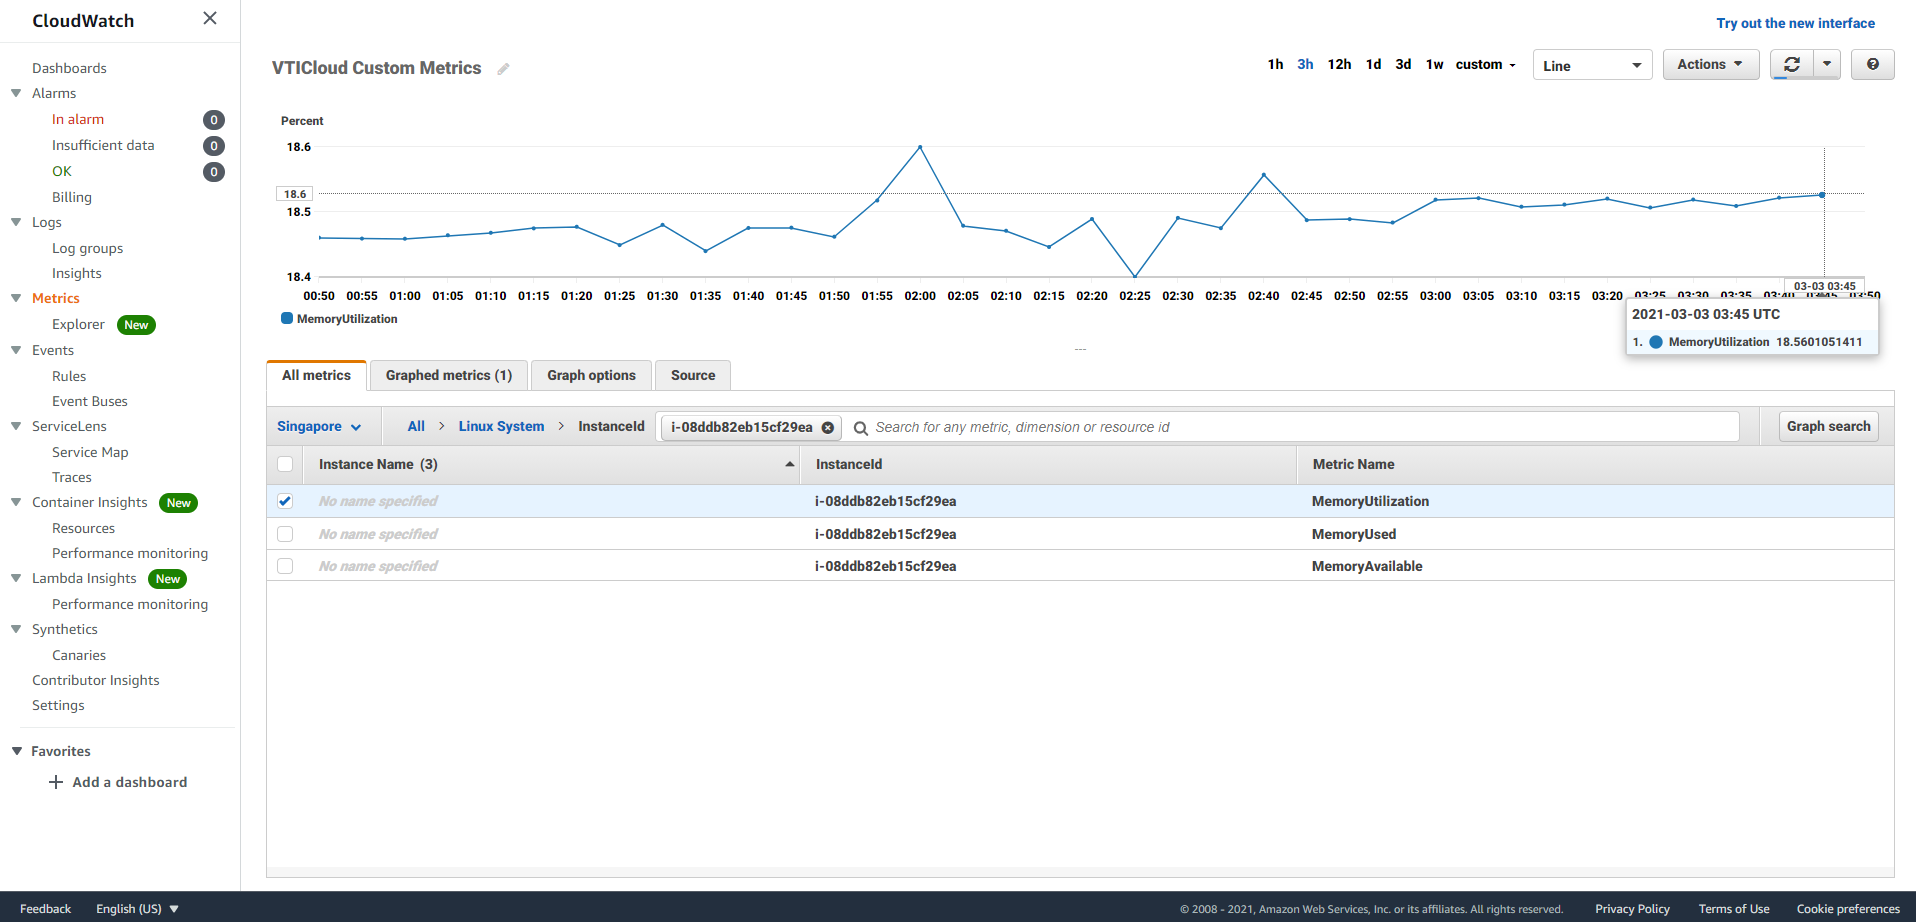
After a while, go back to the Amazon CloudWatch console, choose a metric and you will see we’ve been getting datapoints ever since starting. Be aware that if you don’t have Detailed Monitoring turned on, you will only getting five-minute intervals.
The cool thing about Amazon CloudWatch is you can also install these scripts on your on-premise instances and have them sending data to Amazon CloudWatch, and use Amazon CloudWatch as a holistic monitoring tool for both your AWS and on-premise environment.
Besides, we can use High Resolution for application that need low granularity (< 60 seconds). Follow VTI Cloud for more topic about Amazon CloudWatch.
About VTI Cloud
VTI Cloud is an Advanced Consulting Partner of AWS Vietnam with a team of over 50+ AWS certified solution engineers. With the desire to support customers in the journey of digital transformation and migration to the AWS cloud, VTI Cloud is proud to be a pioneer in consulting solutions, developing software, and deploying AWS infrastructure to customers in Vietnam and Japan.
Building safe, high-performance, flexible, and cost-effective architectures for customers is VTI Cloud’s leading mission in enterprise technology mission.